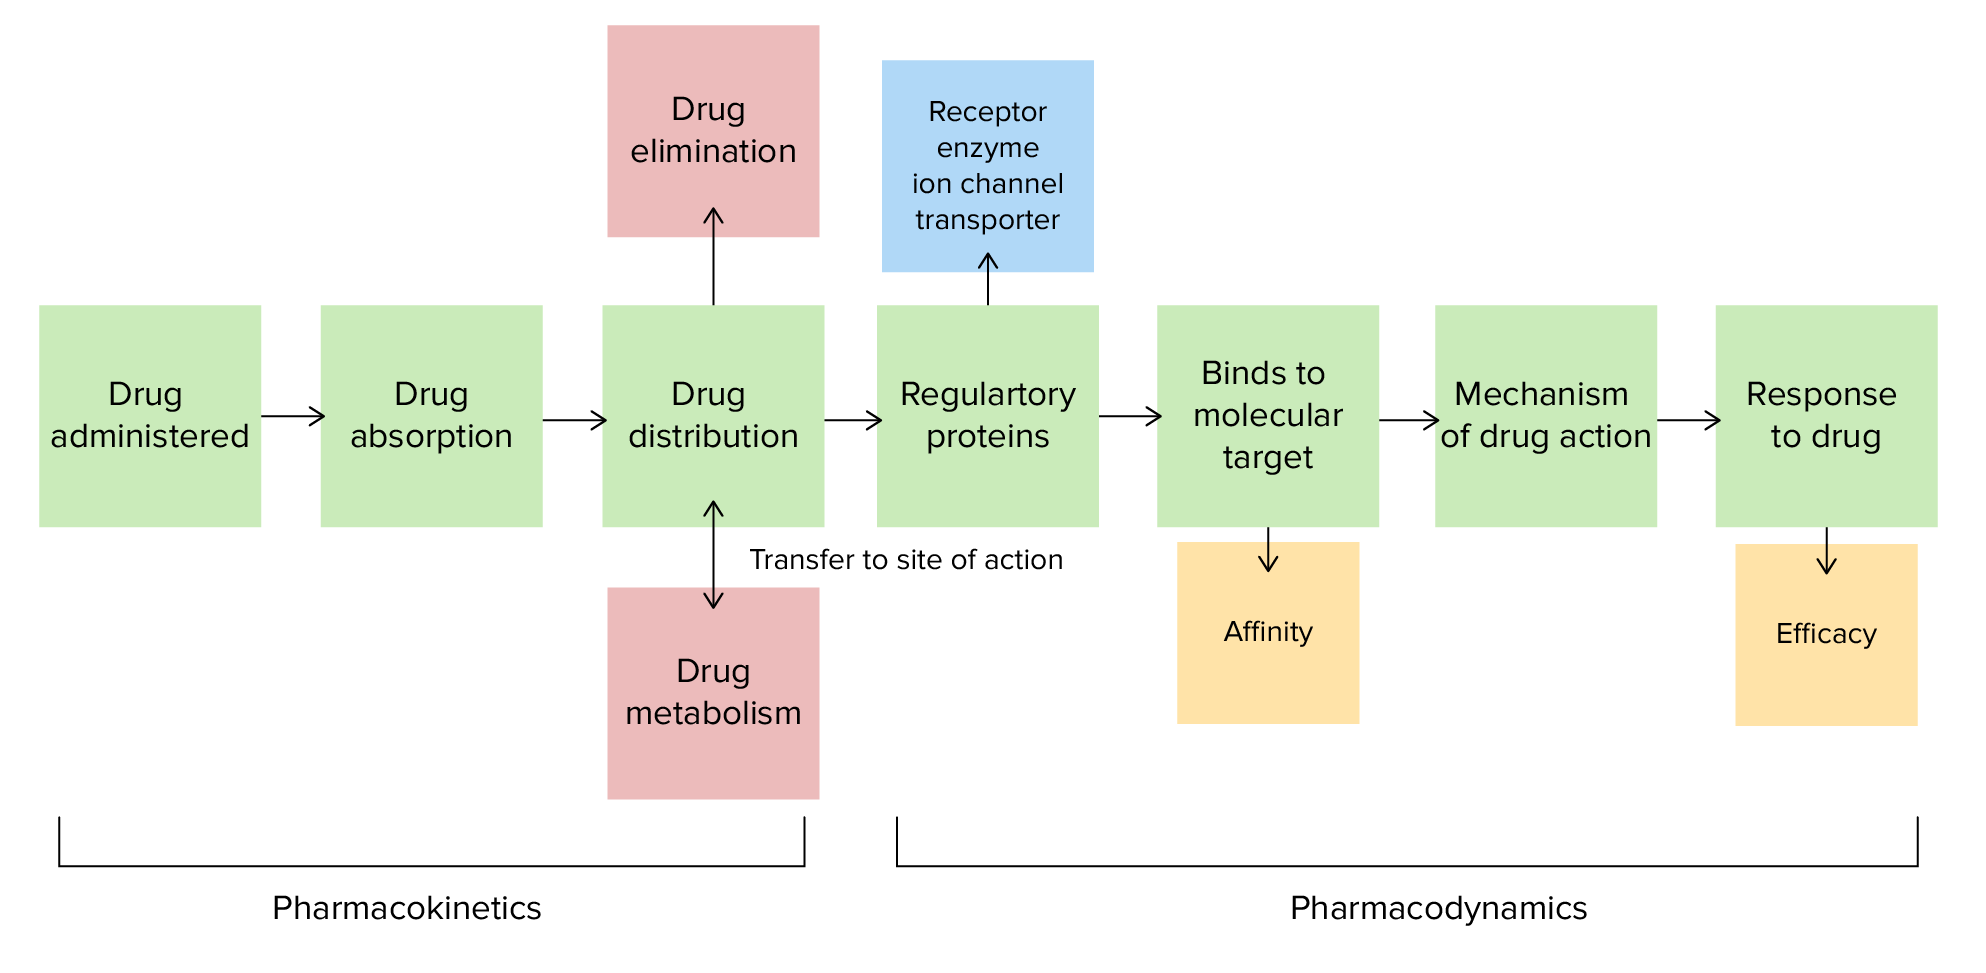
Pharmacokinetics is the science that analyzes how the human body interacts with a drug. Pharmacokinetics examines how the drug is absorbed, distributed, metabolized, and excreted by the body. Pharmacodynamics is the science that studies the biochemical and physiologic effects of a drug and its organ-specific mechanism of action, including effects on the cellular level. Another way to describe the difference between the 2 disciplines is to say that pharmacokinetics is “what the body does to the drug," whereas pharmacodynamics is “what the drug does to the body.” When prescribing medications, physiciansPhysiciansIndividuals licensed to practice medicine.Clinician–Patient Relationship must take into account both the drug’s pharmacodynamics and its pharmacokinetics to determine the correct dosageDosageDosage Calculation and to ensure the appropriate effect.
Pharmacokinetics and pharmacodynamics are fields of study that focus on the interplay between medications and the body.
Pharmacokinetics is the study of how the human body interacts with a drug:
AbsorptionAbsorptionAbsorption involves the uptake of nutrient molecules and their transfer from the lumen of the GI tract across the enterocytes and into the interstitial space, where they can be taken up in the venous or lymphatic circulation.Digestion and Absorption
Distribution
Metabolism/eliminationEliminationThe initial damage and destruction of tumor cells by innate and adaptive immunity. Completion of the phase means no cancer growth. Cancer Immunotherapy
Pharmacodynamics is the study of the effects of a drug and its organ-specific mechanism of action, including effects on the cellular level:
Drug-receptor binding dynamics
Mechanism of action of the drug
Physiologic response
Pharmacokinetics and pharmacodynamics
Image by Lecturio.
Pharmacokinetics: Absorption
Definition
AbsorptionAbsorptionAbsorption involves the uptake of nutrient molecules and their transfer from the lumen of the GI tract across the enterocytes and into the interstitial space, where they can be taken up in the venous or lymphatic circulation.Digestion and Absorption is the transfer of a drug or substance from the site of administration to the bloodstream and is determined by:
The drug’s physicochemical properties:
Lipid solubility
Particle size
Degree of ionization
Drug formulation
Route of administration
Oral
IV
IM
Oral administration
AbsorptionAbsorptionAbsorption involves the uptake of nutrient molecules and their transfer from the lumen of the GI tract across the enterocytes and into the interstitial space, where they can be taken up in the venous or lymphatic circulation.Digestion and Absorption through the GI tract is affected by:
Differences in luminal pHpHThe quantitative measurement of the acidity or basicity of a solution.Acid-Base Balance along the GI tract:
Most drugs are weak organic acidsAcidsChemical compounds which yield hydrogen ions or protons when dissolved in water, whose hydrogen can be replaced by metals or basic radicals, or which react with bases to form salts and water (neutralization). An extension of the term includes substances dissolved in media other than water.Acid-Base Balance or basesBasesUsually a hydroxide of lithium, sodium, potassium, rubidium or cesium, but also the carbonates of these metals, ammonia, and the amines.Acid-Base Balance.
Drugs exist in un-ionized and ionized forms.
The un-ionized form is usually lipid-soluble (lipophilic) and diffuses readily across cell membranes.
The proportion of the un-ionized form is determined by:
The environmental pHpHThe quantitative measurement of the acidity or basicity of a solution.Acid-Base Balance
The drug’s pKa (acid dissociationDissociationDefense Mechanisms constant): the pHpHThe quantitative measurement of the acidity or basicity of a solution.Acid-Base Balance at which concentrations of ionized and un-ionized forms are equal
Surface area per luminal volume:
The small intestineSmall intestineThe small intestine is the longest part of the GI tract, extending from the pyloric orifice of the stomach to the ileocecal junction. The small intestine is the major organ responsible for chemical digestion and absorption of nutrients. It is divided into 3 segments: the duodenum, the jejunum, and the ileum. Small Intestine: Anatomy has the largest surface area.
Most absorptionAbsorptionAbsorption involves the uptake of nutrient molecules and their transfer from the lumen of the GI tract across the enterocytes and into the interstitial space, where they can be taken up in the venous or lymphatic circulation.Digestion and Absorption occurs in the small intestineSmall intestineThe small intestine is the longest part of the GI tract, extending from the pyloric orifice of the stomach to the ileocecal junction. The small intestine is the major organ responsible for chemical digestion and absorption of nutrients. It is divided into 3 segments: the duodenum, the jejunum, and the ileum. Small Intestine: Anatomy.
Blood perfusion of the absorptive membrane:
Decreased blood flowBlood flowBlood flow refers to the movement of a certain volume of blood through the vasculature over a given unit of time (e.g., mL per minute).Vascular Resistance, Flow, and Mean Arterial Pressure (e.g., in shockShockShock is a life-threatening condition associated with impaired circulation that results in tissue hypoxia. The different types of shock are based on the underlying cause: distributive (↑ cardiac output (CO), ↓ systemic vascular resistance (SVR)), cardiogenic (↓ CO, ↑ SVR), hypovolemic (↓ CO, ↑ SVR), obstructive (↓ CO), and mixed. Types of Shock) reduces absorptionAbsorptionAbsorption involves the uptake of nutrient molecules and their transfer from the lumen of the GI tract across the enterocytes and into the interstitial space, where they can be taken up in the venous or lymphatic circulation.Digestion and Absorption.
Presence of bileBileAn emulsifying agent produced in the liver and secreted into the duodenum. Its composition includes bile acids and salts; cholesterol; and electrolytes. It aids digestion of fats in the duodenum.Gallbladder and Biliary Tract: Anatomy and mucus:
In the stomachStomachThe stomach is a muscular sac in the upper left portion of the abdomen that plays a critical role in digestion. The stomach develops from the foregut and connects the esophagus with the duodenum. Structurally, the stomach is C-shaped and forms a greater and lesser curvature and is divided grossly into regions: the cardia, fundus, body, and pylorus. Stomach: Anatomy, a thick mucous layer limits drug absorptionAbsorptionAbsorption involves the uptake of nutrient molecules and their transfer from the lumen of the GI tract across the enterocytes and into the interstitial space, where they can be taken up in the venous or lymphatic circulation.Digestion and Absorption.
Chemical reactions:
HydrolysisHydrolysisThe process of cleaving a chemical compound by the addition of a molecule of water.Proteins and Peptides by gastric acidGastric acidHydrochloric acid present in gastric juice.Gastroesophageal Reflux Disease (GERD) or digestive enzymesEnzymesEnzymes are complex protein biocatalysts that accelerate chemical reactions without being consumed by them. Due to the body’s constant metabolic needs, the absence of enzymes would make life unsustainable, as reactions would occur too slowly without these molecules. Basics of Enzymes
Metabolism by bacterial flora of the GI tract
Transit time:
Rapid transit (e.g., diarrheal states) through the GI tract will hinder absorptionAbsorptionAbsorption involves the uptake of nutrient molecules and their transfer from the lumen of the GI tract across the enterocytes and into the interstitial space, where they can be taken up in the venous or lymphatic circulation.Digestion and Absorption.
Delayed gastric emptyingGastric emptyingThe evacuation of food from the stomach into the duodenum.Gastrointestinal Motility will impair absorptionAbsorptionAbsorption involves the uptake of nutrient molecules and their transfer from the lumen of the GI tract across the enterocytes and into the interstitial space, where they can be taken up in the venous or lymphatic circulation.Digestion and Absorption by the small intestineSmall intestineThe small intestine is the longest part of the GI tract, extending from the pyloric orifice of the stomach to the ileocecal junction. The small intestine is the major organ responsible for chemical digestion and absorption of nutrients. It is divided into 3 segments: the duodenum, the jejunum, and the ileum. Small Intestine: Anatomy.
The nature of epithelial membranes (see below)
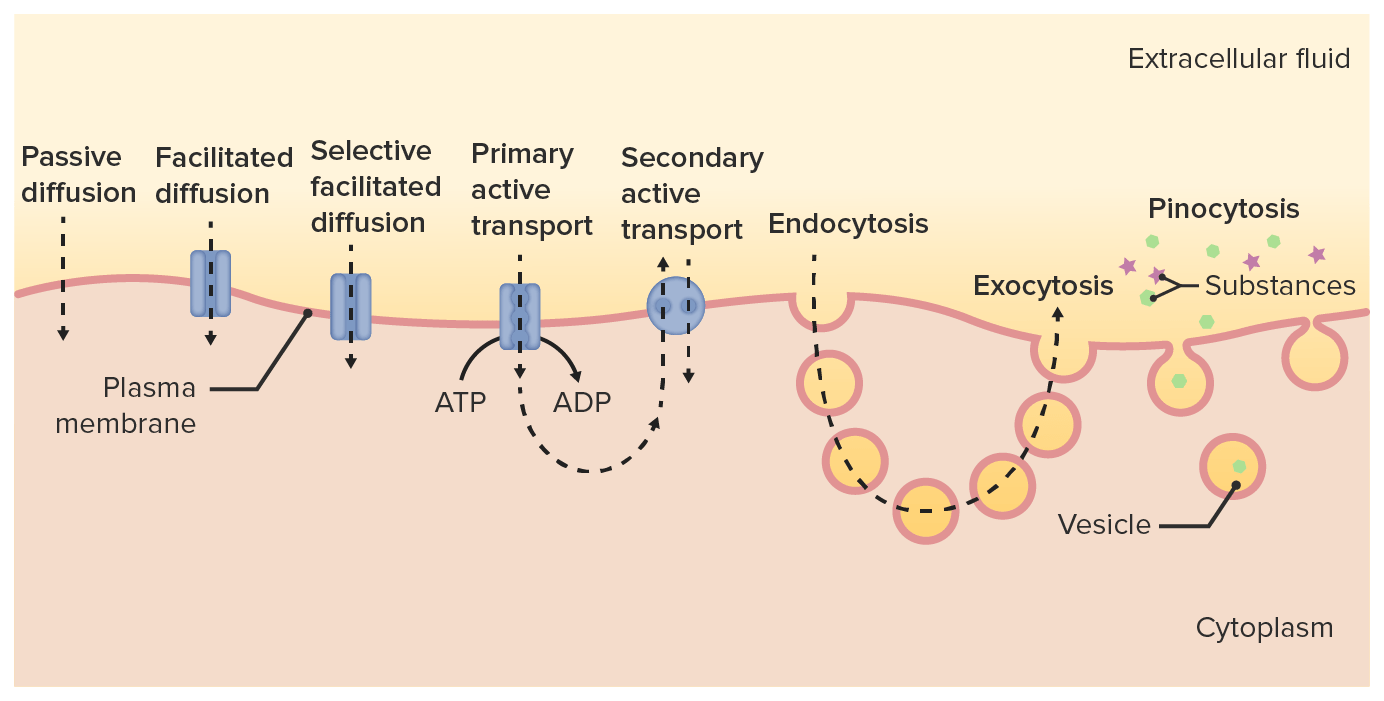
Drugs will cross membranes through:
Passive diffusion, depending on:
Degree of concentration gradient across membrane: Drugs move from high- to low-concentration areas.
Drug’s lipid solubility: Because membranes are lipid, lipid-soluble drugs diffuse more rapidly.
Drug particle size: Small particles penetrate membranes more rapidly.
Degree of ionization: because it determines lipid solubility
Area of absorptive surface: the larger the surface the more the diffusionDiffusionThe tendency of a gas or solute to pass from a point of higher pressure or concentration to a point of lower pressure or concentration and to distribute itself throughout the available space. Diffusion, especially facilitated diffusion, is a major mechanism of biological transport.Peritoneal Dialysis and Hemodialysis
Fick’s law governs passive diffusionDiffusionThe tendency of a gas or solute to pass from a point of higher pressure or concentration to a point of lower pressure or concentration and to distribute itself throughout the available space. Diffusion, especially facilitated diffusion, is a major mechanism of biological transport.Peritoneal Dialysis and Hemodialysis, showing that the diffusionDiffusionThe tendency of a gas or solute to pass from a point of higher pressure or concentration to a point of lower pressure or concentration and to distribute itself throughout the available space. Diffusion, especially facilitated diffusion, is a major mechanism of biological transport.Peritoneal Dialysis and Hemodialysis rate is proportional to:
$$ V_{liquid}= D \frac{A}{T}(C_{1}-C_{2}) $$
D: diffusionDiffusionThe tendency of a gas or solute to pass from a point of higher pressure or concentration to a point of lower pressure or concentration and to distribute itself throughout the available space. Diffusion, especially facilitated diffusion, is a major mechanism of biological transport.Peritoneal Dialysis and Hemodialysis constant for the drug A: surface area of the membrane T: thickness of the membrane C: concentration gradient
Facilitated passive diffusionDiffusionThe tendency of a gas or solute to pass from a point of higher pressure or concentration to a point of lower pressure or concentration and to distribute itself throughout the available space. Diffusion, especially facilitated diffusion, is a major mechanism of biological transport.Peritoneal Dialysis and Hemodialysis:
Requires presence of a carrierCarrierVaccination molecule that binds the drug and carries it across the membrane
The diffusionDiffusionThe tendency of a gas or solute to pass from a point of higher pressure or concentration to a point of lower pressure or concentration and to distribute itself throughout the available space. Diffusion, especially facilitated diffusion, is a major mechanism of biological transport.Peritoneal Dialysis and Hemodialysis still occurs along a concentration gradient.
Does not require energy expenditureEnergy expenditureEnergy expenditure is the sum of internal heat produced and external work.Energy Homeostasis
Active transportActive transportThe movement of materials across cell membranes and epithelial layers against an electrochemical gradient, requiring the expenditure of metabolic energy.The Cell: Cell Membrane:
Occurs with drugs that are similar to endogenous substances—i.e., vitamins, sugars, amino acidsAmino acidsOrganic compounds that generally contain an amino (-NH2) and a carboxyl (-COOH) group. Twenty alpha-amino acids are the subunits which are polymerized to form proteins.Basics of Amino Acids
Different pathways of drug transport across the cell membrane and into the cytoplasm
Image by Lecturio
Bioavailability
The extent and rate at which a drug enters systemic circulationCirculationThe movement of the blood as it is pumped through the cardiovascular system.ABCDE Assessment, thereby accessing the site of action
Relevant only for orally administered drugs, as IV drugs have 100% bioavailability
Factors that affect bioavailability:
Anything affecting absorptionAbsorptionAbsorption involves the uptake of nutrient molecules and their transfer from the lumen of the GI tract across the enterocytes and into the interstitial space, where they can be taken up in the venous or lymphatic circulation.Digestion and Absorption
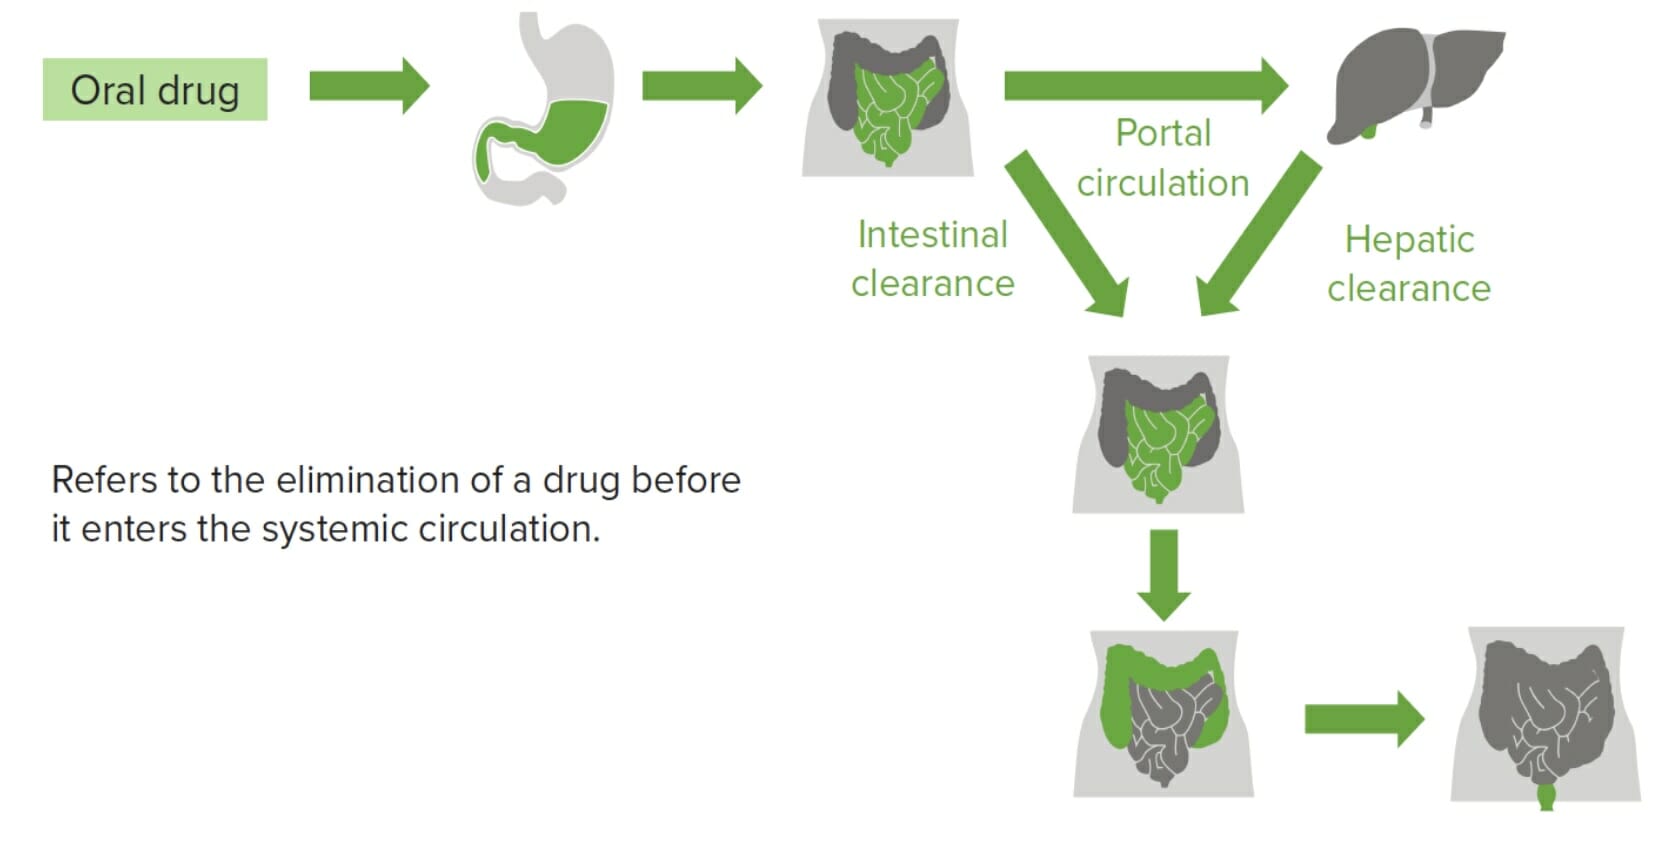
Hepatic 1st-pass metabolism
Drugs absorbed in the GI tract go through the portal circulationCirculationThe movement of the blood as it is pumped through the cardiovascular system.ABCDE Assessment and end up in the liverLiverThe liver is the largest gland in the human body. The liver is found in the superior right quadrant of the abdomen and weighs approximately 1.5 kilograms. Its main functions are detoxification, metabolism, nutrient storage (e.g., iron and vitamins), synthesis of coagulation factors, formation of bile, filtration, and storage of blood. Liver: Anatomy.
The liverLiverThe liver is the largest gland in the human body. The liver is found in the superior right quadrant of the abdomen and weighs approximately 1.5 kilograms. Its main functions are detoxification, metabolism, nutrient storage (e.g., iron and vitamins), synthesis of coagulation factors, formation of bile, filtration, and storage of blood. Liver: Anatomy metabolizes the drug before it enters systemic circulationCirculationThe movement of the blood as it is pumped through the cardiovascular system.ABCDE Assessment, reducing the drug’s bioavailability.
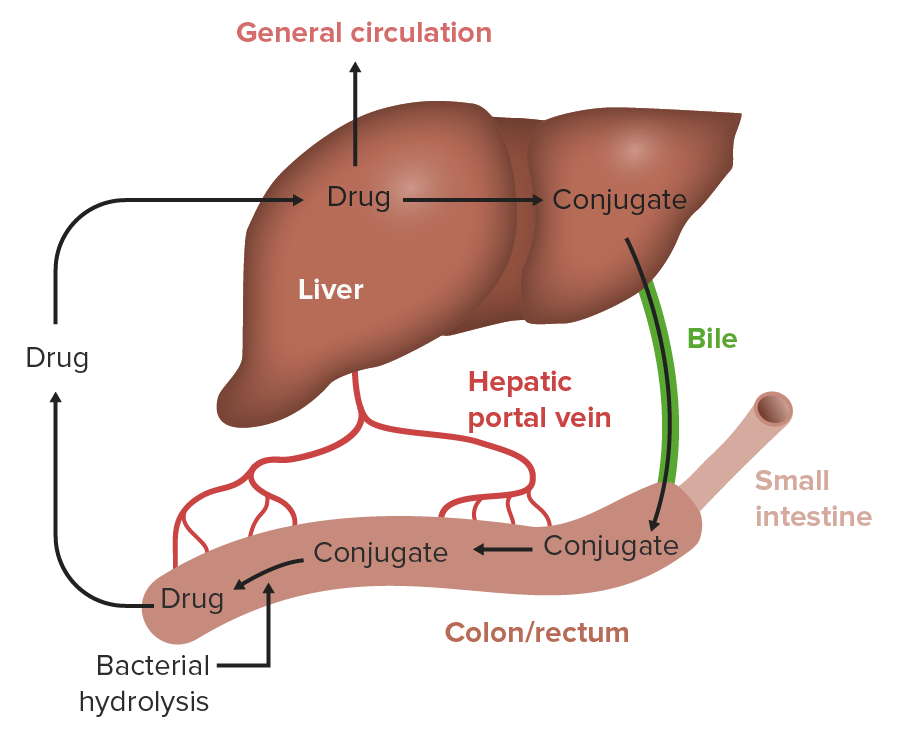
Enterohepatic circulationCirculationThe movement of the blood as it is pumped through the cardiovascular system.ABCDE Assessment:
Drug is absorbed in the GI tract and, through portal circulationCirculationThe movement of the blood as it is pumped through the cardiovascular system.ABCDE Assessment, is taken up by the liverLiverThe liver is the largest gland in the human body. The liver is found in the superior right quadrant of the abdomen and weighs approximately 1.5 kilograms. Its main functions are detoxification, metabolism, nutrient storage (e.g., iron and vitamins), synthesis of coagulation factors, formation of bile, filtration, and storage of blood. Liver: Anatomy.
The active drug or its metabolites are excreted in the bileBileAn emulsifying agent produced in the liver and secreted into the duodenum. Its composition includes bile acids and salts; cholesterol; and electrolytes. It aids digestion of fats in the duodenum.Gallbladder and Biliary Tract: Anatomy and then into the intestine.
The gut microbiota deconjugate drug metabolites to release the parent drug molecule.
The drug is then reabsorbed in the intestine → cycle restarts
Recirculation may produce multiple peaks in the drug’s plasmaPlasmaThe residual portion of blood that is left after removal of blood cells by centrifugation without prior blood coagulation.Transfusion Products concentration.
Phenomenon of a drug undergoing 1st-pass metabolism, during which it is partially or completely metabolized in the intestinal wall or is absorbed in the intestine and enters the portal circulation and travels to the liver, where the drug is metabolized further.
Distribution isthe extent to which a drug is transported from the systemic circulationCirculationThe movement of the blood as it is pumped through the cardiovascular system.ABCDE Assessment to target tissues and organs.
Volume of distribution (Vd)
The volume necessary to contain the total amount of a drug at the same concentration in which it is observed in plasmaPlasmaThe residual portion of blood that is left after removal of blood cells by centrifugation without prior blood coagulation.Transfusion Products
Can also be conceptualized as the ratio of the amount of drug in a body (dose) to concentration of the drug measured in blood and plasmaPlasmaThe residual portion of blood that is left after removal of blood cells by centrifugation without prior blood coagulation.Transfusion Products and unbound in interstitial fluidInterstitial fluidBody Fluid Compartments
A theoretical volume that provides a reference for the plasmaPlasmaThe residual portion of blood that is left after removal of blood cells by centrifugation without prior blood coagulation.Transfusion Products concentration expected for a given dose
Tissue permeability of drugs; depends on a drug’s:
Molecular size: Smaller molecules distribute to a larger degree into tissues.
pKa: determines degree of ionization and thus lipophilicity:
Lipophilic drugs dissolve in lipidsLipidsLipids are a diverse group of hydrophobic organic molecules, which include fats, oils, sterols, and waxes.Fatty Acids and Lipids: lipid diffusionDiffusionThe tendency of a gas or solute to pass from a point of higher pressure or concentration to a point of lower pressure or concentration and to distribute itself throughout the available space. Diffusion, especially facilitated diffusion, is a major mechanism of biological transport.Peritoneal Dialysis and Hemodialysis
Lipophilic drugs can cross lipid cell membranes.
Lipophilic drugs can cross the blood–brainBrainThe part of central nervous system that is contained within the skull (cranium). Arising from the neural tube, the embryonic brain is comprised of three major parts including prosencephalon (the forebrain); mesencephalon (the midbrain); and rhombencephalon (the hindbrain). The developed brain consists of cerebrum; cerebellum; and other structures in the brain stem.Nervous System: Anatomy, Structure, and Classification and placental barriers.
HydrophilicHydrophilicAminoglycosides drugs dissolve in water: aqueous diffusionDiffusionThe tendency of a gas or solute to pass from a point of higher pressure or concentration to a point of lower pressure or concentration and to distribute itself throughout the available space. Diffusion, especially facilitated diffusion, is a major mechanism of biological transport.Peritoneal Dialysis and Hemodialysis
Blood–brain barrierBlood–Brain BarrierMeningitis in Children: In brainBrainThe part of central nervous system that is contained within the skull (cranium). Arising from the neural tube, the embryonic brain is comprised of three major parts including prosencephalon (the forebrain); mesencephalon (the midbrain); and rhombencephalon (the hindbrain). The developed brain consists of cerebrum; cerebellum; and other structures in the brain stem.Nervous System: Anatomy, Structure, and ClassificationcapillariesCapillariesCapillaries are the primary structures in the circulatory system that allow the exchange of gas, nutrients, and other materials between the blood and the extracellular fluid (ECF). Capillaries are the smallest of the blood vessels. Because a capillary diameter is so small, only 1 RBC may pass through at a time.Capillaries: Histology, endothelial cells are connected with tight intercellular junctionsIntercellular junctionsDirect contact of a cell with a neighboring cell. Most such junctions are too small to be resolved by light microscopy, but they can be visualized by conventional or freeze-fracture electron microscopy, both of which show that the interacting cell membrane and often the underlying cytoplasm and the intervening extracellular space are highly specialized in these regions.Surface Epithelium: Histology.
Placental barrierPlacental barrierThe placental barrier is a selectively permeable membrane separating the maternal and fetal blood.Placenta, Umbilical Cord, and Amniotic Cavity: formed by fetal trophoblastic basement membraneBasement membraneA darkly stained mat-like extracellular matrix (ecm) that separates cell layers, such as epithelium from endothelium or a layer of connective tissue. The ecm layer that supports an overlying epithelium or endothelium is called basal lamina. Basement membrane (bm) can be formed by the fusion of either two adjacent basal laminae or a basal lamina with an adjacent reticular lamina of connective tissue. Bm, composed mainly of type IV collagen; glycoprotein laminin; and proteoglycan, provides barriers as well as channels between interacting cell layers.Thin Basement Membrane Nephropathy (TBMN) and an endothelial layer
Blood–testis barrier: formed by tight junctionsTight junctionsCell-cell junctions that seal adjacent epithelial cells together, preventing the passage of most dissolved molecules from one side of the epithelial sheet to the other.The Cell: Cell Junctions between Sertoli testicular cells
Cardiac outputCardiac outputThe volume of blood passing through the heart per unit of time. It is usually expressed as liters (volume) per minute so as not to be confused with stroke volume (volume per beat).Cardiac Mechanics/regional blood flowBlood flowBlood flow refers to the movement of a certain volume of blood through the vasculature over a given unit of time (e.g., mL per minute).Vascular Resistance, Flow, and Mean Arterial Pressure:
The higher the organ blood flowBlood flowBlood flow refers to the movement of a certain volume of blood through the vasculature over a given unit of time (e.g., mL per minute).Vascular Resistance, Flow, and Mean Arterial Pressure, the greater the drug distribution
AlbuminAlbuminSerum albumin from humans. It is an essential carrier of both endogenous substances, such as fatty acids and bilirubin, and of xenobiotics in the blood.Liver Function Tests is the main drug-binding protein in plasmaPlasmaThe residual portion of blood that is left after removal of blood cells by centrifugation without prior blood coagulation.Transfusion Products.
Other binding proteinsProteinsLinear polypeptides that are synthesized on ribosomes and may be further modified, crosslinked, cleaved, or assembled into complex proteins with several subunits. The specific sequence of amino acids determines the shape the polypeptide will take, during protein folding, and the function of the protein.Energy Homeostasis are alpha-1 acid glycoprotein and lipoproteinsLipoproteinsLipid-protein complexes involved in the transportation and metabolism of lipids in the body. They are spherical particles consisting of a hydrophobic core of triglycerides and cholesterol esters surrounded by a layer of hydrophilic free cholesterol; phospholipids; and apolipoproteins. Lipoproteins are classified by their varying buoyant density and sizes.Lipid Metabolism.
Only unbound drug can passively diffuse to extravascular or tissue sites to exert its effects.
The unbound drug concentration in plasmaPlasmaThe residual portion of blood that is left after removal of blood cells by centrifugation without prior blood coagulation.Transfusion Products determines drug concentration at the active siteActive siteArea of an enzyme that binds to specific substrate molecules in order to facilitate a reaction.Basics of Enzymes and efficacy.
Albumin-bound drugs remain intravascular.
High protein binding decreases volume of distribution, as drugs cannot diffuse into tissues.
Adipose tissueAdipose tissueAdipose tissue is a specialized type of connective tissue that has both structural and highly complex metabolic functions, including energy storage, glucose homeostasis, and a multitude of endocrine capabilities. There are three types of adipose tissue, white adipose tissue, brown adipose tissue, and beige or “brite” adipose tissue, which is a transitional form.Adipose Tissue: Histology: affects volume of distribution of lipophilic drugs
Organ composition: immature nervous systemNervous systemThe nervous system is a small and complex system that consists of an intricate network of neural cells (or neurons) and even more glial cells (for support and insulation). It is divided according to its anatomical components as well as its functional characteristics. The brain and spinal cord are referred to as the central nervous system, and the branches of nerves from these structures are referred to as the peripheral nervous system.Nervous System: Anatomy, Structure, and Classification in infants → greater distribution of drugs into brainBrainThe part of central nervous system that is contained within the skull (cranium). Arising from the neural tube, the embryonic brain is comprised of three major parts including prosencephalon (the forebrain); mesencephalon (the midbrain); and rhombencephalon (the hindbrain). The developed brain consists of cerebrum; cerebellum; and other structures in the brain stem.Nervous System: Anatomy, Structure, and Classification
PlasmaPlasmaThe residual portion of blood that is left after removal of blood cells by centrifugation without prior blood coagulation.Transfusion Products protein content is lower in infants and elderly.
SexSexThe totality of characteristics of reproductive structure, functions, phenotype, and genotype, differentiating the male from the female organism.Gender Dysphoria:
PregnancyPregnancyThe status during which female mammals carry their developing young (embryos or fetuses) in utero before birth, beginning from fertilization to birth.Pregnancy: Diagnosis, Physiology, and Care:
Increased blood volume leads to greater Vd.
The fetus is a separate compartment in which drugs can distribute.
ObesityObesityObesity is a condition associated with excess body weight, specifically with the deposition of excessive adipose tissue. Obesity is considered a global epidemic. Major influences come from the western diet and sedentary lifestyles, but the exact mechanisms likely include a mixture of genetic and environmental factors. Obesity:
High adipose tissueAdipose tissueAdipose tissue is a specialized type of connective tissue that has both structural and highly complex metabolic functions, including energy storage, glucose homeostasis, and a multitude of endocrine capabilities. There are three types of adipose tissue, white adipose tissue, brown adipose tissue, and beige or “brite” adipose tissue, which is a transitional form.Adipose Tissue: Histology leads to higher distribution and accumulation of lipophilic drugs.
Disease states can affect:
PlasmaPlasmaThe residual portion of blood that is left after removal of blood cells by centrifugation without prior blood coagulation.Transfusion ProductsalbuminAlbuminSerum albumin from humans. It is an essential carrier of both endogenous substances, such as fatty acids and bilirubin, and of xenobiotics in the blood.Liver Function Tests concentrations
Tissue perfusion: i.e., hypoperfusion in shockShockShock is a life-threatening condition associated with impaired circulation that results in tissue hypoxia. The different types of shock are based on the underlying cause: distributive (↑ cardiac output (CO), ↓ systemic vascular resistance (SVR)), cardiogenic (↓ CO, ↑ SVR), hypovolemic (↓ CO, ↑ SVR), obstructive (↓ CO), and mixed. Types of Shock
Tissue pHpHThe quantitative measurement of the acidity or basicity of a solution.Acid-Base Balance: i.e., lactic acidosisLactic AcidosisOxazolidinones due to sepsisSepsisSystemic inflammatory response syndrome with a proven or suspected infectious etiology. When sepsis is associated with organ dysfunction distant from the site of infection, it is called severe sepsis. When sepsis is accompanied by hypotension despite adequate fluid infusion, it is called septic shock.Sepsis and Septic Shock
Alteration in physiologic barriers: MeningitisMeningitisMeningitis is inflammation of the meninges, the protective membranes of the brain, and spinal cord. The causes of meningitis are varied, with the most common being bacterial or viral infection. The classic presentation of meningitis is a triad of fever, altered mental status, and nuchal rigidity. Meningitis alters the blood–brain barrierBlood–Brain BarrierMeningitis in Children.
Diet:
A diet high in fatsFatsThe glyceryl esters of a fatty acid, or of a mixture of fatty acids. They are generally odorless, colorless, and tasteless if pure, but they may be flavored according to origin. Fats are insoluble in water, soluble in most organic solvents. They occur in animal and vegetable tissue and are generally obtained by boiling or by extraction under pressure. They are important in the diet (dietary fats) as a source of energy.Energy Homeostasis increases free fatty acidsAcidsChemical compounds which yield hydrogen ions or protons when dissolved in water, whose hydrogen can be replaced by metals or basic radicals, or which react with bases to form salts and water (neutralization). An extension of the term includes substances dissolved in media other than water.Acid-Base Balance, which compete with drugs for binding to albuminAlbuminSerum albumin from humans. It is an essential carrier of both endogenous substances, such as fatty acids and bilirubin, and of xenobiotics in the blood.Liver Function Tests.
MalnutritionMalnutritionMalnutrition is a clinical state caused by an imbalance or deficiency of calories and/or micronutrients and macronutrients. The 2 main manifestations of acute severe malnutrition are marasmus (total caloric insufficiency) and kwashiorkor (protein malnutrition with characteristic edema).Malnutrition in children in resource-limited countries decreases plasmaPlasmaThe residual portion of blood that is left after removal of blood cells by centrifugation without prior blood coagulation.Transfusion ProductsalbuminAlbuminSerum albumin from humans. It is an essential carrier of both endogenous substances, such as fatty acids and bilirubin, and of xenobiotics in the blood.Liver Function Tests levels, affecting drug binding and tissue distribution.
Drug interactions:
DisplacementDisplacementThe process by which an emotional or behavioral response that is appropriate for one situation appears in another situation for which it is inappropriate.Defense Mechanisms occurs when 2 drugs that have the same affinity for the same binding site are administered concomitantly.
Biotransformation isthe process through which the human body chemically changes drugs into different molecules to either make the compound pharmacologically active or to facilitate eliminationEliminationThe initial damage and destruction of tumor cells by innate and adaptive immunity. Completion of the phase means no cancer growth. Cancer Immunotherapy.
Metabolism is a type of biotransformation.
Usually takes place in the liverLiverThe liver is the largest gland in the human body. The liver is found in the superior right quadrant of the abdomen and weighs approximately 1.5 kilograms. Its main functions are detoxification, metabolism, nutrient storage (e.g., iron and vitamins), synthesis of coagulation factors, formation of bile, filtration, and storage of blood. Liver: Anatomy, through hepatic enzymesEnzymesEnzymes are complex protein biocatalysts that accelerate chemical reactions without being consumed by them. Due to the body’s constant metabolic needs, the absence of enzymes would make life unsustainable, as reactions would occur too slowly without these molecules. Basics of Enzymes
When a drug or parent compound is metabolized, it can be converted into:
Inactive form
Pharmacologically active form
Toxic metabolite
Phases of biotransformation
Phase I reactions: change the drug into a polar metabolite, which makes it more water-soluble
This is done by either unmasking or inserting a polar group (–OH, –SH, –NH2).
Performed by cytochrome P450Cytochrome P450A superfamily of hundreds of closely related hemeproteins found throughout the phylogenetic spectrum, from animals, plants, fungi, to bacteria. They include numerous complex monooxygenases (mixed function oxygenases). In animals, these p450 enzymes serve two major functions: (1) biosynthesis of steroids, fatty acids, and bile acids; (2) metabolism of endogenous and a wide variety of exogenous substrates, such as toxins and drugs (biotransformation). They are classified, according to their sequence similarities rather than functions, into cyp gene families (>40% homology) and subfamilies (>59% homology). For example, enzymes from the cyp1, cyp2, and cyp3 gene families are responsible for most drug metabolism.Drug-Induced Liver Injury (CYP450) isoenzymesIsoenzymesStructurally related forms of an enzyme. Each isoenzyme has the same mechanism and classification, but differs in its chemical, physical, or immunological characteristics.Basics of Enzymes in the liverLiverThe liver is the largest gland in the human body. The liver is found in the superior right quadrant of the abdomen and weighs approximately 1.5 kilograms. Its main functions are detoxification, metabolism, nutrient storage (e.g., iron and vitamins), synthesis of coagulation factors, formation of bile, filtration, and storage of blood. Liver: Anatomy
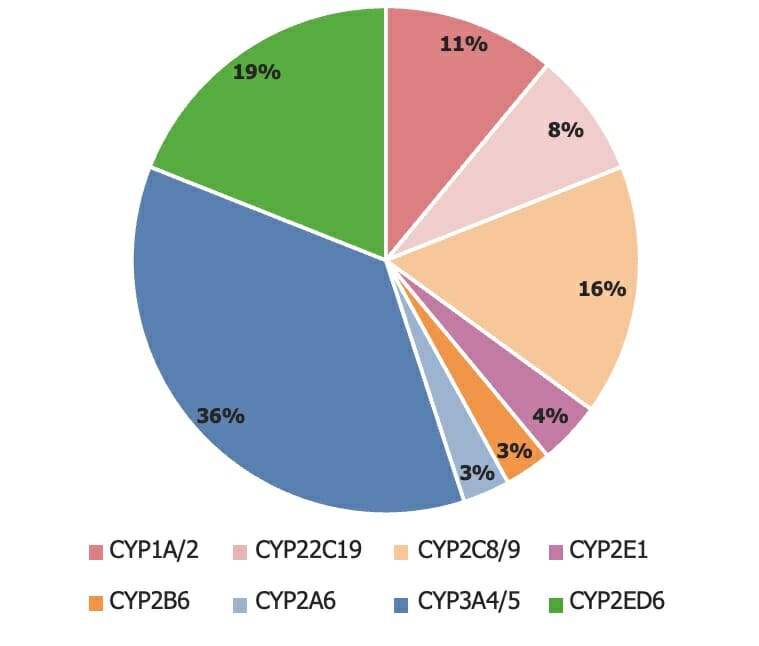
75% of drugs are metabolized by CYP450-3A4, CYP450-3A5, and CYP450-2D6.
Phase II reactions: conjugationConjugationA parasexual process in bacteria; algae; fungi; and ciliate eukaryota for achieving exchange of chromosome material during fusion of two cells. In bacteria, this is a unidirectional transfer of genetic material; in protozoa it is a bi-directional exchange. In algae and fungi, it is a form of sexual reproduction, with the union of male and female gametes.Bacteriology of the metabolite with compounds to increase water solubility, including:
Glutathione conjugationConjugationA parasexual process in bacteria; algae; fungi; and ciliate eukaryota for achieving exchange of chromosome material during fusion of two cells. In bacteria, this is a unidirectional transfer of genetic material; in protozoa it is a bi-directional exchange. In algae and fungi, it is a form of sexual reproduction, with the union of male and female gametes.Bacteriology
Sulfation
MethylationMethylationAddition of methyl groups. In histo-chemistry methylation is used to esterify carboxyl groups and remove sulfate groups by treating tissue sections with hot methanol in the presence of hydrochloric acid. .Glucocorticoids
Phase III reactions: further processing of the drugs, including:
Preparation of a drug for excretion into the bileBileAn emulsifying agent produced in the liver and secreted into the duodenum. Its composition includes bile acids and salts; cholesterol; and electrolytes. It aids digestion of fats in the duodenum.Gallbladder and Biliary Tract: Anatomy, urine, or other lumens
There is great genetic variability in the activity of enzymesEnzymesEnzymes are complex protein biocatalysts that accelerate chemical reactions without being consumed by them. Due to the body’s constant metabolic needs, the absence of enzymes would make life unsustainable, as reactions would occur too slowly without these molecules. Basics of Enzymes involved in all 3 phases.
As a result, individuals may exhibit significant differences in their ability to metabolize the same drug.
A great number of medications can induce and inhibit the P450 enzyme system.
The assortment of cytochrome P450 (CYP450) isoenzymes
A drug may inhibit or induce the metabolism of another drug.
Direct inhibition of CYP450:
AmiodaroneAmiodaroneAn antianginal and class III antiarrhythmic drug. It increases the duration of ventricular and atrial muscle action by inhibiting potassium channels and voltage-gated sodium channels. There is a resulting decrease in heart rate and in vascular resistance.Pulmonary Fibrosis, ritonavirRitonavirAn HIV protease inhibitor that works by interfering with the reproductive cycle of HIV. It also inhibits cytochrome p-450 cyp3a.Anti-HIV Drugs, cimetidineCimetidineA histamine congener, it competitively inhibits histamine binding to histamine h2 receptors. Cimetidine has a range of pharmacological actions. It inhibits gastric acid secretion, as well as pepsin and gastrin output.Antihistamines, grapefruit juice, fluconazoleFluconazoleTriazole antifungal agent that is used to treat oropharyngeal candidiasis and cryptococcal meningitis in aids.Azoles
Suicide inhibitorsSuicide inhibitorsEnzyme Inhibition: irreversible enzyme/receptorReceptorReceptors are proteins located either on the surface of or within a cell that can bind to signaling molecules known as ligands (e.g., hormones) and cause some type of response within the cell.Receptors inhibition, e.g., secobarbital
Induction of CYP450:
Antiseizure medications, ethanolEthanolA clear, colorless liquid rapidly absorbed from the gastrointestinal tract and distributed throughout the body. It has bactericidal activity and is used often as a topical disinfectant. It is widely used as a solvent and preservative in pharmaceutical preparations as well as serving as the primary ingredient in alcoholic beverages.Ethanol Metabolism, St. John’s Wort, rifampinRifampinA semisynthetic antibiotic produced from streptomyces mediterranei. It has a broad antibacterial spectrum, including activity against several forms of Mycobacterium. In susceptible organisms it inhibits dna-dependent RNA polymerase activity by forming a stable complex with the enzyme. It thus suppresses the initiation of RNA synthesis. Rifampin is bactericidal, and acts on both intracellular and extracellular organisms.Epiglottitis
Inhibition of P-glycoprotein (multidrug resistantMultidrug resistantResistant to at least 1 agent in > 3 antibiotic categoriesPseudomonasmutationMutationGenetic mutations are errors in DNA that can cause protein misfolding and dysfunction. There are various types of mutations, including chromosomal, point, frameshift, and expansion mutations. Types of Mutations (MDR1))
Moves drugs from inside the cell to the intestinal lumen
Inhibitors include verapamilVerapamilA calcium channel blocker that is a class IV anti-arrhythmia agent.Pulmonary Hypertension Drugs and grapefruit juice.
Medications metabolized by MDR1 include cyclosporineCyclosporineA cyclic undecapeptide from an extract of soil fungi. It is a powerful immunosupressant with a specific action on T-lymphocytes. It is used for the prophylaxis of graft rejection in organ and tissue transplantation.Immunosuppressants and digoxinDigoxinA cardiotonic glycoside obtained mainly from digitalis lanata; it consists of three sugars and the aglycone digoxigenin. Digoxin has positive inotropic and negative chronotropic activity. It is used to control ventricular rate in atrial fibrillation and in the management of congestive heart failure with atrial fibrillation. Its use in congestive heart failure and sinus rhythm is less certain. The margin between toxic and therapeutic doses is small.Cardiac Glycosides
Amount of blood flowBlood flowBlood flow refers to the movement of a certain volume of blood through the vasculature over a given unit of time (e.g., mL per minute).Vascular Resistance, Flow, and Mean Arterial Pressure to the liverLiverThe liver is the largest gland in the human body. The liver is found in the superior right quadrant of the abdomen and weighs approximately 1.5 kilograms. Its main functions are detoxification, metabolism, nutrient storage (e.g., iron and vitamins), synthesis of coagulation factors, formation of bile, filtration, and storage of blood. Liver: Anatomy
Rate of metabolism
1st-order kinetics:
At therapeutic concentrations, only a small fraction of the metabolizing enzyme’s sites are occupied by the drug.
The metabolism rate increases with drug concentration.
The metabolism rate of the drug is a constant fraction of the drug remaining in the body.
The drug has a specific half-life: time needed for the plasmaPlasmaThe residual portion of blood that is left after removal of blood cells by centrifugation without prior blood coagulation.Transfusion Products concentration to reduce to half its original value.
Zero-order kinetics:
Most of the metabolizing enzyme drug-binding sites are occupied.
Metabolism occurs at its maximal rate and does not change in proportion to drug concentration.
In this case, no specific half-life can be determined.
As drug concentration increases, metabolism shifts from 1st-order to zero-order kinetics.
Mnemonics for CYP450 inducers and inhibitors
Inducers: PARC GPS
Phenytoin
Alcohol (ethanolEthanolA clear, colorless liquid rapidly absorbed from the gastrointestinal tract and distributed throughout the body. It has bactericidal activity and is used often as a topical disinfectant. It is widely used as a solvent and preservative in pharmaceutical preparations as well as serving as the primary ingredient in alcoholic beverages.Ethanol Metabolism)
Rifampin
Carbamazepine
Griseofulvin
Phenobarbital
Smoking
St. John’s wort
Inhibitors: PACMAN-G
Protease inhibitors
Azole antifungals
Cimetidine
Macrolides
Amiodarone
Nondihydropyridine (non-DHP) calciumCalciumA basic element found in nearly all tissues. It is a member of the alkaline earth family of metals with the atomic symbol ca, atomic number 20, and atomic weight 40. Calcium is the most abundant mineral in the body and combines with phosphorus to form calcium phosphate in the bones and teeth. It is essential for the normal functioning of nerves and muscles and plays a role in blood coagulation (as factor IV) and in many enzymatic processes.Electrolytes channel blockers (CCBsCCBsCalcium channel blockers (CCBS) are a class of medications that inhibit voltage-dependent L-type calcium channels of cardiac and vascular smooth muscle cells. The inhibition of these channels produces vasodilation and myocardial depression. There are 2 major classes of CCBS: dihydropyridines and non-dihydropyridines.Class 4 Antiarrhythmic Drugs (Calcium Channel Blockers))
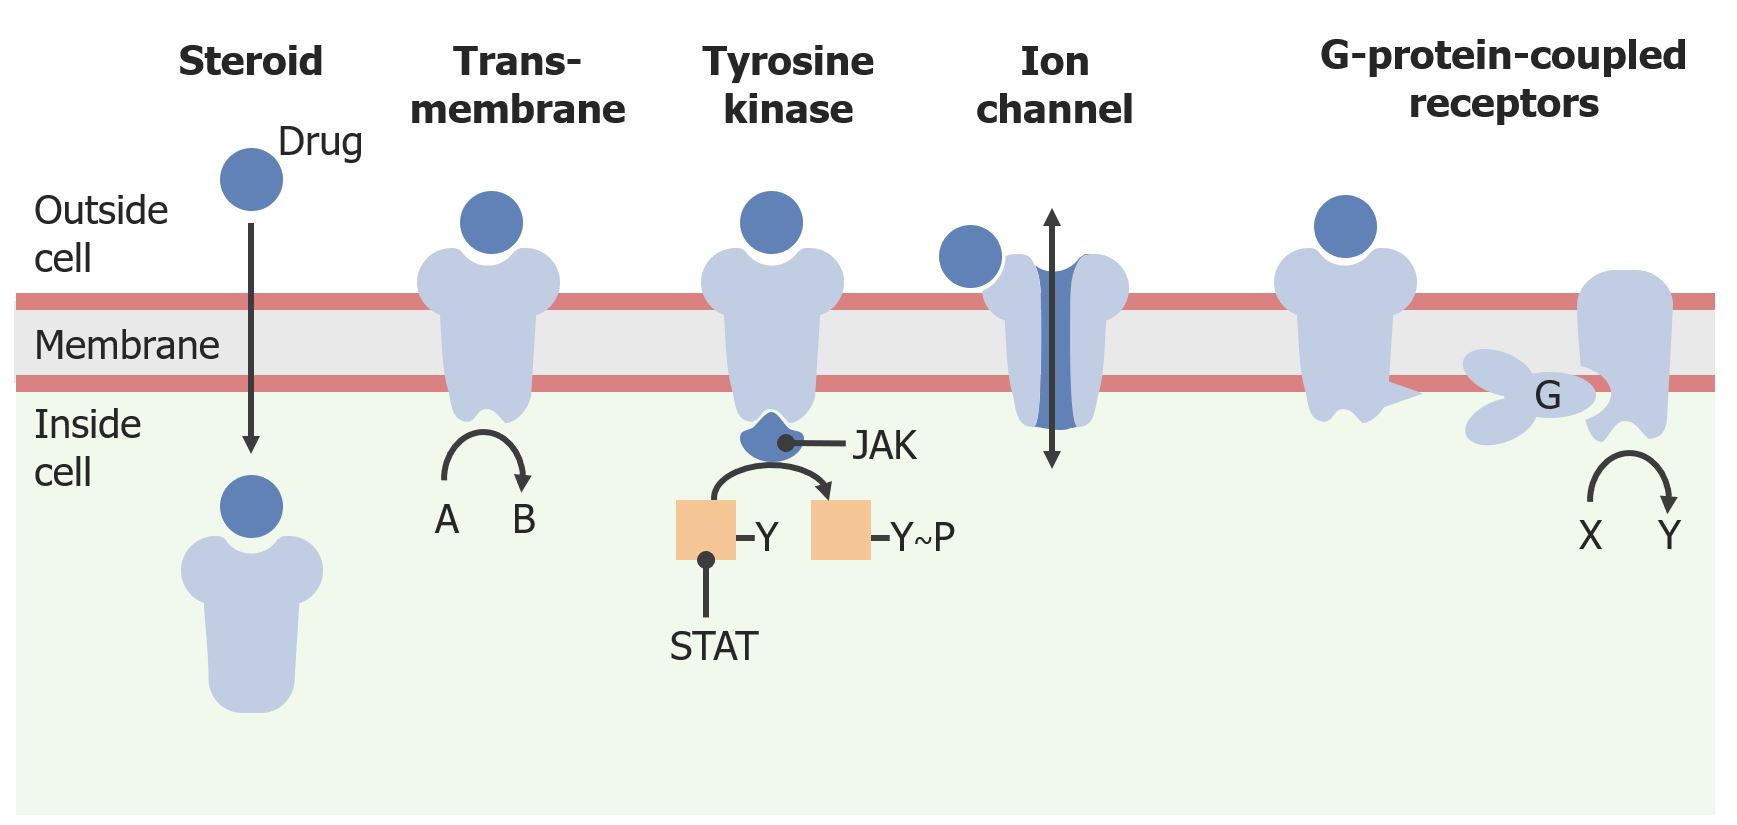
ReceptorsReceptorsReceptors are proteins located either on the surface of or within a cell that can bind to signaling molecules known as ligands (e.g., hormones) and cause some type of response within the cell.Receptors are macromolecules involved in chemical signaling between and within cells.
These receptorsReceptorsReceptors are proteins located either on the surface of or within a cell that can bind to signaling molecules known as ligands (e.g., hormones) and cause some type of response within the cell.Receptors may be located on the cell surface membrane or within the cytoplasm:
Cell surface receptorsReceptorsReceptors are proteins located either on the surface of or within a cell that can bind to signaling molecules known as ligands (e.g., hormones) and cause some type of response within the cell.Receptors have a transmembrane part that connects them to the cytoplasm:
G-protein–coupled receptorsReceptorsReceptors are proteins located either on the surface of or within a cell that can bind to signaling molecules known as ligands (e.g., hormones) and cause some type of response within the cell.Receptors
TyrosineTyrosineA non-essential amino acid. In animals it is synthesized from phenylalanine. It is also the precursor of epinephrine; thyroid hormones; and melanin.Synthesis of Nonessential Amino Acids kinase receptorsReceptorsReceptors are proteins located either on the surface of or within a cell that can bind to signaling molecules known as ligands (e.g., hormones) and cause some type of response within the cell.Receptors
Intracellular receptorsReceptorsReceptors are proteins located either on the surface of or within a cell that can bind to signaling molecules known as ligands (e.g., hormones) and cause some type of response within the cell.Receptors (e.g., steroid receptorsReceptorsReceptors are proteins located either on the surface of or within a cell that can bind to signaling molecules known as ligands (e.g., hormones) and cause some type of response within the cell.Receptors): The drug or ligand must be lipophilic.
Steroid receptorsReceptorsReceptors are proteins located either on the surface of or within a cell that can bind to signaling molecules known as ligands (e.g., hormones) and cause some type of response within the cell.Receptors
ThyroidThyroidThe thyroid gland is one of the largest endocrine glands in the human body. The thyroid gland is a highly vascular, brownish-red gland located in the visceral compartment of the anterior region of the neck.Thyroid Gland: Anatomy hormone receptorsReceptorsReceptors are proteins located either on the surface of or within a cell that can bind to signaling molecules known as ligands (e.g., hormones) and cause some type of response within the cell.Receptors
Vitamin AVitamin ARetinol and derivatives of retinol that play an essential role in metabolic functioning of the retina, the growth of and differentiation of epithelial tissue, the growth of bone, reproduction, and the immune response. Dietary vitamin A is derived from a variety of carotenoids found in plants. It is enriched in the liver, egg yolks, and the fat component of dairy products.Fat-soluble Vitamins and their Deficiencies and D receptorsReceptorsReceptors are proteins located either on the surface of or within a cell that can bind to signaling molecules known as ligands (e.g., hormones) and cause some type of response within the cell.Receptors
A drug can bindBINDHyperbilirubinemia of the Newborn a specific molecular region of the receptorReceptorReceptors are proteins located either on the surface of or within a cell that can bind to signaling molecules known as ligands (e.g., hormones) and cause some type of response within the cell.Receptors called the recognition site.
The recognition site of a drug may be different from that of another drug binding to the same receptorReceptorReceptors are proteins located either on the surface of or within a cell that can bind to signaling molecules known as ligands (e.g., hormones) and cause some type of response within the cell.Receptors.
A drug binding to a receptorReceptorReceptors are proteins located either on the surface of or within a cell that can bind to signaling molecules known as ligands (e.g., hormones) and cause some type of response within the cell.Receptors can activate or deactivate it, leading to increased or decreased function:
Agonists activate receptorsReceptorsReceptors are proteins located either on the surface of or within a cell that can bind to signaling molecules known as ligands (e.g., hormones) and cause some type of response within the cell.Receptors to produce the desired response.
Antagonists prevent receptorReceptorReceptors are proteins located either on the surface of or within a cell that can bind to signaling molecules known as ligands (e.g., hormones) and cause some type of response within the cell.Receptors activation:
Can be reversible or irreversible (suicideSuicideSuicide is one of the leading causes of death worldwide. Patients with chronic medical conditions or psychiatric disorders are at increased risk of suicidal ideation, attempt, and/or completion. The patient assessment of suicide risk is very important as it may help to prevent a serious suicide attempt, which may result in death. Suicide antagonists)
Competitive antagonistsprevent binding of the agonist to the receptorReceptorReceptors are proteins located either on the surface of or within a cell that can bind to signaling molecules known as ligands (e.g., hormones) and cause some type of response within the cell.Receptors.
Noncompetitive antagonistsallow binding of the agonist to the receptorReceptorReceptors are proteins located either on the surface of or within a cell that can bind to signaling molecules known as ligands (e.g., hormones) and cause some type of response within the cell.Receptors but reduce or prevent its effect.
A drug’s ability to affect a given receptorReceptorReceptors are proteins located either on the surface of or within a cell that can bind to signaling molecules known as ligands (e.g., hormones) and cause some type of response within the cell.Receptors is related to its:
Affinity: probabilityProbabilityProbability is a mathematical tool used to study randomness and provide predictions about the likelihood of something happening. There are several basic rules of probability that can be used to help determine the probability of multiple events happening together, separately, or sequentially.Basics of Probability of the drug occupying a receptorReceptorReceptors are proteins located either on the surface of or within a cell that can bind to signaling molecules known as ligands (e.g., hormones) and cause some type of response within the cell.Receptors at any given instant
A drug’s affinity and activity are determined by its chemical structure.
A drug’s affinity for the receptorReceptorReceptors are proteins located either on the surface of or within a cell that can bind to signaling molecules known as ligands (e.g., hormones) and cause some type of response within the cell.Receptors determines the amount of drug needed to produce a therapeutic effect.
Intrinsic efficacy: degree to which a ligand activates receptorsReceptorsReceptors are proteins located either on the surface of or within a cell that can bind to signaling molecules known as ligands (e.g., hormones) and cause some type of response within the cell.Receptors and leads to cellular response
The duration of time that the drug–receptorReceptorReceptors are proteins located either on the surface of or within a cell that can bind to signaling molecules known as ligands (e.g., hormones) and cause some type of response within the cell.Receptors complex persists determines the pharmacologic effect :
Transient occupancy of the receptorReceptorReceptors are proteins located either on the surface of or within a cell that can bind to signaling molecules known as ligands (e.g., hormones) and cause some type of response within the cell.Receptors produces the desired pharmacologic effect
ReceptorReceptorReceptors are proteins located either on the surface of or within a cell that can bind to signaling molecules known as ligands (e.g., hormones) and cause some type of response within the cell.Receptors up- and down-regulation: ReceptorReceptorReceptors are proteins located either on the surface of or within a cell that can bind to signaling molecules known as ligands (e.g., hormones) and cause some type of response within the cell.Receptors density is proportional to receptorReceptorReceptors are proteins located either on the surface of or within a cell that can bind to signaling molecules known as ligands (e.g., hormones) and cause some type of response within the cell.Receptors binding.
Low drug concentration leads to up-regulation of receptorsReceptorsReceptors are proteins located either on the surface of or within a cell that can bind to signaling molecules known as ligands (e.g., hormones) and cause some type of response within the cell.Receptors
High drug concentration leads to down-regulation of receptorsReceptorsReceptors are proteins located either on the surface of or within a cell that can bind to signaling molecules known as ligands (e.g., hormones) and cause some type of response within the cell.Receptors
Tolerance:reduced drug effect over time due to changes in number and function of receptorsReceptorsReceptors are proteins located either on the surface of or within a cell that can bind to signaling molecules known as ligands (e.g., hormones) and cause some type of response within the cell.Receptors
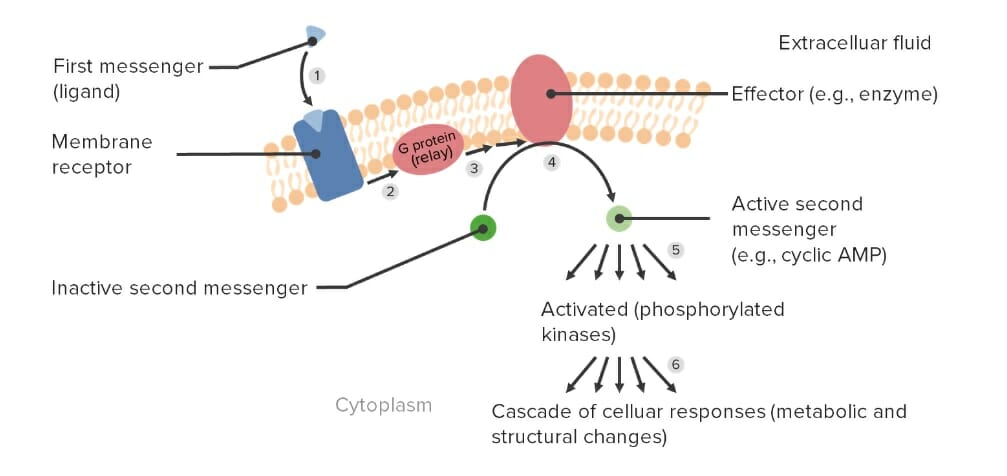
2nd messengers: intracellular molecules activated in response to drug–receptorReceptorReceptors are proteins located either on the surface of or within a cell that can bind to signaling molecules known as ligands (e.g., hormones) and cause some type of response within the cell.Receptors interaction. Example:
Drug (epinephrineEpinephrineThe active sympathomimetic hormone from the adrenal medulla. It stimulates both the alpha- and beta- adrenergic systems, causes systemic vasoconstriction and gastrointestinal relaxation, stimulates the heart, and dilates bronchi and cerebral vessels.Sympathomimetic Drugs) binds to the receptorReceptorReceptors are proteins located either on the surface of or within a cell that can bind to signaling molecules known as ligands (e.g., hormones) and cause some type of response within the cell.Receptors G-protein.
The receptorReceptorReceptors are proteins located either on the surface of or within a cell that can bind to signaling molecules known as ligands (e.g., hormones) and cause some type of response within the cell.Receptors makes a change in the G-protein.
The effector catalyzes a reaction that increases the concentration of the 2nd messenger (cAMPcAMPAn adenine nucleotide containing one phosphate group which is esterified to both the 3′- and 5′-positions of the sugar moiety. It is a second messenger and a key intracellular regulator, functioning as a mediator of activity for a number of hormones, including epinephrine, glucagon, and acth.Phosphodiesterase Inhibitors)
cAMPcAMPAn adenine nucleotide containing one phosphate group which is esterified to both the 3′- and 5′-positions of the sugar moiety. It is a second messenger and a key intracellular regulator, functioning as a mediator of activity for a number of hormones, including epinephrine, glucagon, and acth.Phosphodiesterase Inhibitors increases heart rateHeart rateThe number of times the heart ventricles contract per unit of time, usually per minute.Cardiac Physiology, dilation of skeletal muscle blood vessels, and breakdown of glycogen to glucoseGlucoseA primary source of energy for living organisms. It is naturally occurring and is found in fruits and other parts of plants in its free state. It is used therapeutically in fluid and nutrient replacement.Lactose Intolerance.
Different categories of cell surface and intracellular receptors
Image by Lecturio.
G-protein–mediated signal transduction and activation of a 2nd-messenger system: (1) The 1st messenger or drug binds to the G-protein–coupled receptor and (2) activates the G-protein, which (3) relays a signal to (4) activate the effector molecule. The effector then (5) activates 2nd messengers to (6) elicit cellular responses.
The effect of a drug is the physical response it elicits. This may be a desired (therapeutic) effect or an undesired (toxic) effect. The effect can be modulated by the presence of antagonists and is also determined by its affinity to its target molecular receptorReceptorReceptors are proteins located either on the surface of or within a cell that can bind to signaling molecules known as ligands (e.g., hormones) and cause some type of response within the cell.Receptors. These effects are measured and can be visually represented through curves.
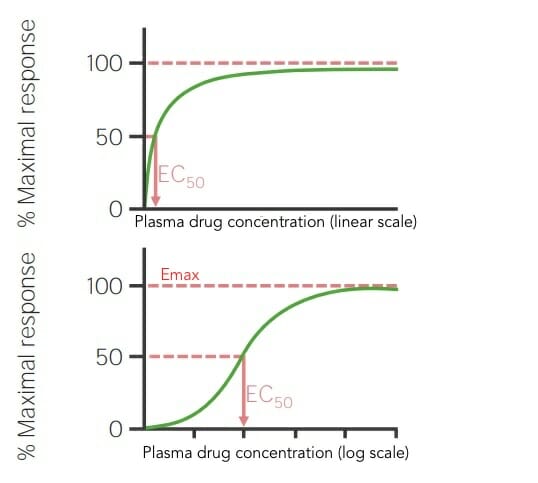
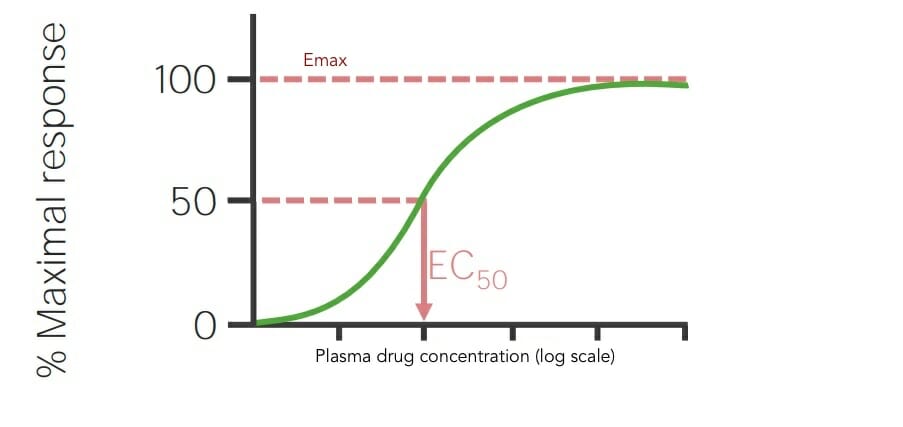
Dose–response curves
Graphical representations of the relationship between the dosageDosageDosage Calculation of a drug given and the amount of effect it produces
The dose of drug is plotted on the x-axis and the maximal % response on the y-axis.
Expressed as a sigmoid-shaped log curve
Emax: drug dose or concentration that elicits a maximal effect (response)
ED50: drug dose or concentration (EC50) that produces 50% maximal effect (response)
Slope of the curve gives the change in effect per unit of drug concentration increased
When viewing a dose–response curve:
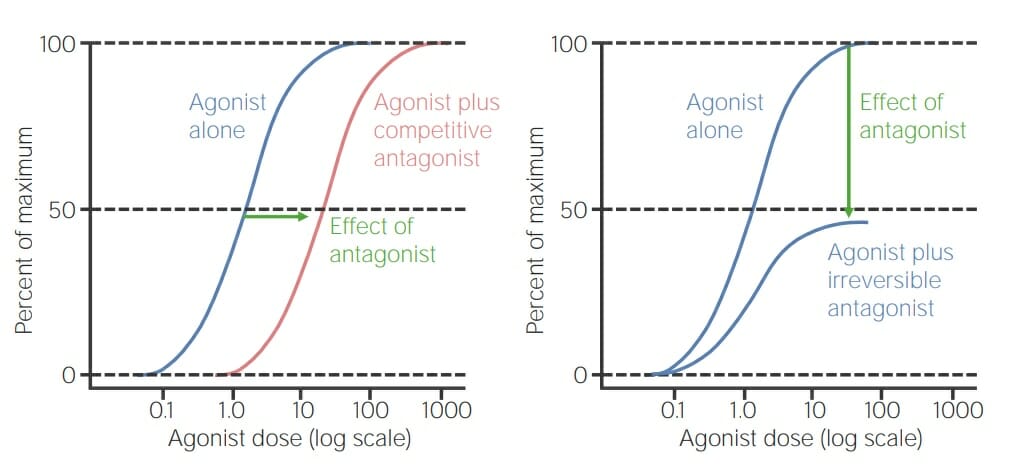
Agonist alone achieves 100% effect
Addition of competitive antagonist: a higher agonist dose is needed to still achieve 100% effect → curve shifts right
Addition of noncompetitive inhibitor: a higher agonist dose will not achieve 100% effect and maximal effect achievable of agonist is reduced → curve does not shift
Dose–response curves in linear and log scale showing the drug dose or concentration that elicits a maximal effect (Emax) and the drug concentration that produces 50% maximal effect (EC50)
Image by Lecturio.
Dose–response curve comparing agonist alone versus agonist with a competitive antagonist (left): Note that the same effect occurs at a higher dose of agonist when the competitive antagonist is dissociated. The curve is simply shifted to the right. Right curve: In comparison, this is a dose–response curve comparing agonist alone versus agonist with an irreversible antagonist. The 2 curves start at the same concentration but reach different maximal points given that the irreversible antagonist action is independent of the concentration of the agonist. The response is reduced to 50% of its maximum potential.
Image by Lecturio.
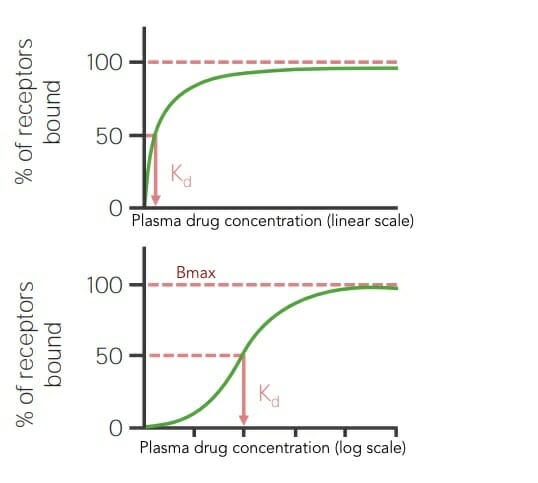
Binding curves
Express the concentration of a drug needed to saturate a specific receptorReceptorReceptors are proteins located either on the surface of or within a cell that can bind to signaling molecules known as ligands (e.g., hormones) and cause some type of response within the cell.Receptors
Dose of the drug on the x-axis, and maximal % of bound receptorsReceptorsReceptors are proteins located either on the surface of or within a cell that can bind to signaling molecules known as ligands (e.g., hormones) and cause some type of response within the cell.Receptors on the y-axis
Defined as the drug concentration that results in 50% of receptorsReceptorsReceptors are proteins located either on the surface of or within a cell that can bind to signaling molecules known as ligands (e.g., hormones) and cause some type of response within the cell.Receptors being bound
Lower Kd → higher binding affinity of drug for receptorReceptorReceptors are proteins located either on the surface of or within a cell that can bind to signaling molecules known as ligands (e.g., hormones) and cause some type of response within the cell.Receptors
Higher Kd → weaker binding affinity of the drug for receptorReceptorReceptors are proteins located either on the surface of or within a cell that can bind to signaling molecules known as ligands (e.g., hormones) and cause some type of response within the cell.Receptors
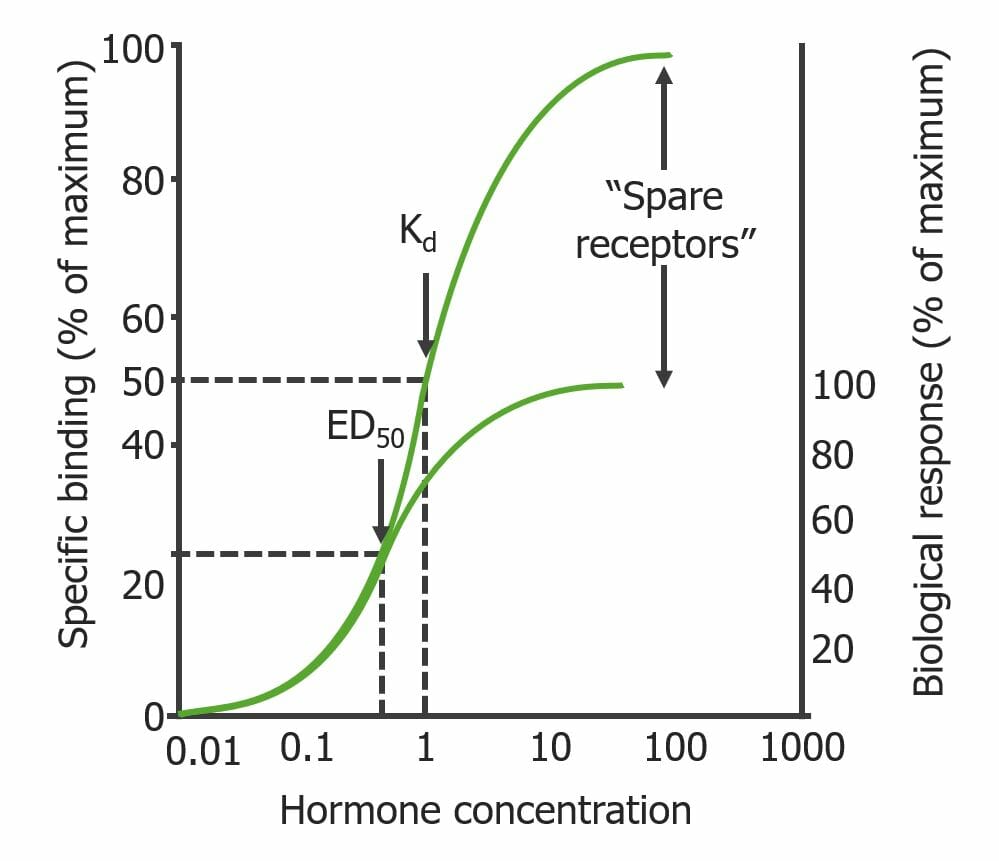
Maximal biologic response (Bmax) does not always require full receptorReceptorReceptors are proteins located either on the surface of or within a cell that can bind to signaling molecules known as ligands (e.g., hormones) and cause some type of response within the cell.Receptors occupancy by drug
Sometimes ED50 is achieved at a drug concentration less than Kd; this is due to the presence of “spare” receptorsReceptorsReceptors are proteins located either on the surface of or within a cell that can bind to signaling molecules known as ligands (e.g., hormones) and cause some type of response within the cell.Receptors.
Spare receptorsReceptorsReceptors are proteins located either on the surface of or within a cell that can bind to signaling molecules known as ligands (e.g., hormones) and cause some type of response within the cell.Receptors differ based on drug, organ, and species.
Binding curves in linear and log scale showing the maximal biologic response (Bmax) and dissociation constant (Kd) for a drug
Image by Lecturio.
Binding curve illustrating the “spare receptor” phenomenon: There is a maximal biological response despite the presence of receptors that are not bound by the drug. Note that the drug concentration required to occupy 50% of receptors (Kd) is higher than the concentration needed to elicit a maximum response (ED50): Kd > ED50.
Image by Lecturio.
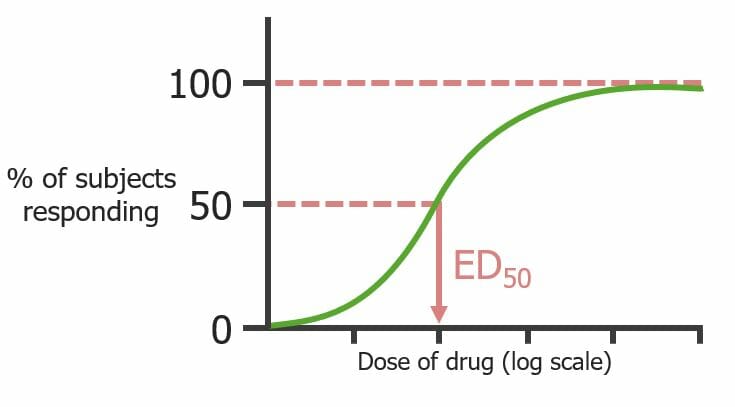
Quantal curves
In a population, there is usually some variation of doses required to achieve the defined drug effect
A quantal dose response describes a defined drug effect that is either present or absent
Dose of a drug on the x-axis, and % responders on the y-axis for a population
The cumulative percentage of the population responses to increasing doses is plotted as a sigmoidSigmoidA segment of the colon between the rectum and the descending colon.Volvulus shape
E50 : drug dose that elicits the defined drug effect in 50% of subjects
Quantal dose–response curve (looks at population, not single receptors) noting the dose of a drug that produces a predetermined effect in 50% of subjects (E50)
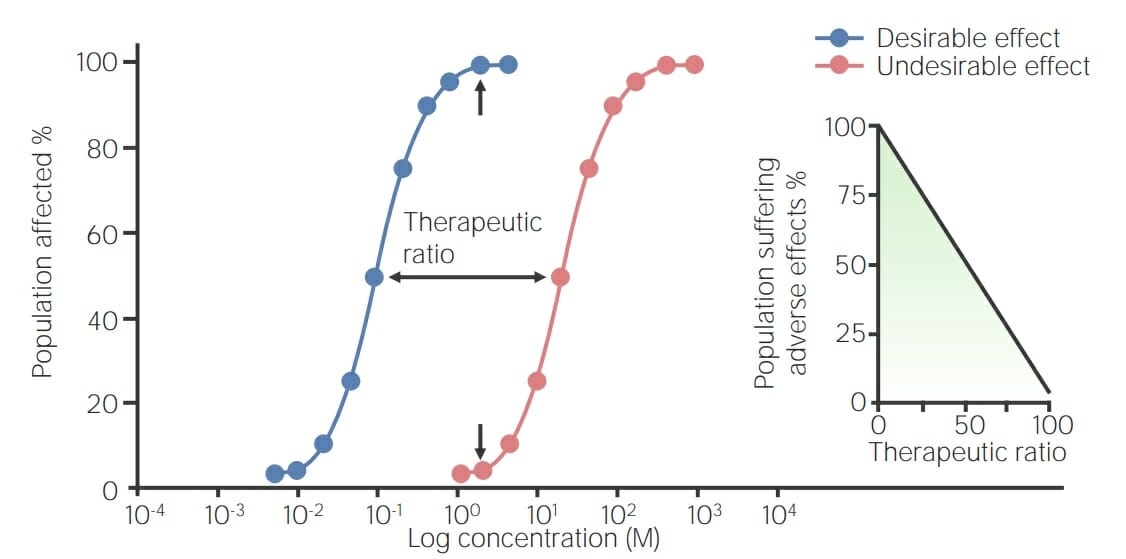
Graph of a toxicity curve: The blue dose–response curve represents a drug’s desired effect in a population, and the red dose–toxicity curve represents the drug’s undesirable effect. The therapeutic ratio, or index (TI), lies between the 2 curves and equals dose for a toxic effect in 50% of population/drug concentration that produces 50% maximal effect (TD50/EC50), starting at the 50% maximal effective dose and ending at the 50% toxic dose. The inset shows the relation between therapeutic ratio and adverse effects seen. The greater the therapeutic ratio, the fewer occurrences of adverse effects, and vice versa.
Image by Lecturio.
Potency curves
Potency is determined by the affinity of a drug for its receptorReceptorReceptors are proteins located either on the surface of or within a cell that can bind to signaling molecules known as ligands (e.g., hormones) and cause some type of response within the cell.Receptors:
The greater the affinity, the higher the potency
Potency curves consist of dose–response curves of different drugs for comparison.
Potency is the concentration (EC50) or dose (ED50) of a drug that produces 50% of the maximal effect.
The higher a drug’s potency, the lower its EC50 (or ED50)
Example: A drug with an ED50 of 5 mg is 10x more potent than a drug whose ED50 is 50 mg.
Illustration of dose–response curves of different drugs for comparison of their concentration needed to produce a 50% maximal effect (EC50): Emax is the maximal effect. Lower EC50 = greater potency. The drug farthest to the left on the graph (represented by the dotted gray line) has the highest potency of the 4 drugs plotted because it has the lowest concentration (indicated on x-axis) needed to produce a 50% maximal effect. Shifting from the curves left to right, the potency of the drugs decreases, with the solid gray line to the far right being the least potent drug.
Rate of eliminationEliminationThe initial damage and destruction of tumor cells by innate and adaptive immunity. Completion of the phase means no cancer growth. Cancer Immunotherapy
EliminationEliminationThe initial damage and destruction of tumor cells by innate and adaptive immunity. Completion of the phase means no cancer growth. Cancer Immunotherapy is the process of conversion of a drug to inactive metabolites, which are ultimately excreted from the body.
LiverLiverThe liver is the largest gland in the human body. The liver is found in the superior right quadrant of the abdomen and weighs approximately 1.5 kilograms. Its main functions are detoxification, metabolism, nutrient storage (e.g., iron and vitamins), synthesis of coagulation factors, formation of bile, filtration, and storage of blood. Liver: Anatomy (hepatic): primary organ for metabolic eliminationEliminationThe initial damage and destruction of tumor cells by innate and adaptive immunity. Completion of the phase means no cancer growth. Cancer Immunotherapy of drugs
Kidney (renal): primary organ for excretory eliminationEliminationThe initial damage and destruction of tumor cells by innate and adaptive immunity. Completion of the phase means no cancer growth. Cancer Immunotherapy of drugs
Rate of eliminationEliminationThe initial damage and destruction of tumor cells by innate and adaptive immunity. Completion of the phase means no cancer growth. Cancer Immunotherapy of drug (massMassThree-dimensional lesion that occupies a space within the breastImaging of the Breast/time) = clearance x concentration.
Clearance
Volume of plasmaPlasmaThe residual portion of blood that is left after removal of blood cells by centrifugation without prior blood coagulation.Transfusion Products cleared of drug per unit time (volume/time)
Total systemic clearance (CLtotal):
A drug can be cleared through many pathways and organs.
Measured by glomerular filtration rateGlomerular filtration rateThe volume of water filtered out of plasma through glomerular capillary walls into Bowman’s capsules per unit of time. It is considered to be equivalent to inulin clearance.Kidney Function Tests (GFRGFRThe volume of water filtered out of plasma through glomerular capillary walls into Bowman’s capsules per unit of time. It is considered to be equivalent to inulin clearance.Kidney Function Tests)
Determined by the drug’s plasmaPlasmaThe residual portion of blood that is left after removal of blood cells by centrifugation without prior blood coagulation.Transfusion Products concentration and whether it undergoes active secretionSecretionCoagulation Studies or reabsorption in the kidney
Drugs cannot passively diffuse from the blood across the glomerular membrane if they:
Are bound to protein
Have a molecular weight > 60,000 daltons
Some drugs are actively secreted from the blood into the proximal tubules.
Many drugs are passively reabsorbed back into the blood at the distal tubules.
Calculating renal clearance:
GFRGFRThe volume of water filtered out of plasma through glomerular capillary walls into Bowman’s capsules per unit of time. It is considered to be equivalent to inulin clearance.Kidney Function Tests can be calculated:
GFRGFRThe volume of water filtered out of plasma through glomerular capillary walls into Bowman’s capsules per unit of time. It is considered to be equivalent to inulin clearance.Kidney Function Tests equations offer guidance on dosing of renally cleared drugs.
Measures the urinary clearance of an endogenous filtration marker
Serum creatinine is the most frequently used endogenous filtration marker.
Creatinine clearanceCreatinine clearanceKidney Function Tests is used to approximate GFRGFRThe volume of water filtered out of plasma through glomerular capillary walls into Bowman’s capsules per unit of time. It is considered to be equivalent to inulin clearance.Kidney Function Tests and measure kidney function.
Creatinine clearanceCreatinine clearanceKidney Function Tests is the volume of plasmaPlasmaThe residual portion of blood that is left after removal of blood cells by centrifugation without prior blood coagulation.Transfusion Products cleared of creatinine per unit of time.
Creatinine is a by-product of normal muscle breakdown and protein-rich foods.
Serum creatinine levels vary by age, weight, sexSexThe totality of characteristics of reproductive structure, functions, phenotype, and genotype, differentiating the male from the female organism.Gender Dysphoria, and muscle massMassThree-dimensional lesion that occupies a space within the breastImaging of the Breast.
Modification of diet in renal disease (MDRD): uses 4 variables (age, race, serum creatinine, sexSexThe totality of characteristics of reproductive structure, functions, phenotype, and genotype, differentiating the male from the female organism.Gender Dysphoria)
Chronic kidney disease-epidemiology (CKD-EPI): uses age, race, serum creatinine, sexSexThe totality of characteristics of reproductive structure, functions, phenotype, and genotype, differentiating the male from the female organism.Gender Dysphoria
Equations can overestimate GFRGFRThe volume of water filtered out of plasma through glomerular capillary walls into Bowman’s capsules per unit of time. It is considered to be equivalent to inulin clearance.Kidney Function Tests because creatinine undergoes tubular secretionSecretionCoagulation Studies.
When not to use creatinine-based renal clearance equations:
Unstable creatinine concentrations
Extremes in muscle massMassThree-dimensional lesion that occupies a space within the breastImaging of the Breast (bodybuilders) or diet (anorexiaAnorexiaThe lack or loss of appetite accompanied by an aversion to food and the inability to eat. It is the defining characteristic of the disorder anorexia nervosa.Anorexia Nervosa)
In individuals who are paraplegic or otherwise immobile
CreatineCreatineAn amino acid that occurs in vertebrate tissues and in urine. In muscle tissue, creatine generally occurs as phosphocreatine. Creatine is excreted as creatinine in the urine.Acute Kidney Injury dietary supplements
Extremes of age
Cystatin CCystatin CAn extracellular cystatin subtype that is abundantly expressed in bodily fluids. It may play a role in the inhibition of interstitial cysteine proteases.Kidney Function Tests–based renal clearance equations:
More accurate endogenous renal filtration marker than creatinine
Cystatin CCystatin CAn extracellular cystatin subtype that is abundantly expressed in bodily fluids. It may play a role in the inhibition of interstitial cysteine proteases.Kidney Function Tests is a proteaseProteaseEnzyme of the human immunodeficiency virus that is required for post-translational cleavage of gag and gag-pol precursor polyproteins into functional products needed for viral assembly. HIV protease is an aspartic protease encoded by the amino terminus of the pol gene.HIV Infection and AIDS inhibitor produced by all nucleated cells.
CKD-EPI cystatin CCystatin CAn extracellular cystatin subtype that is abundantly expressed in bodily fluids. It may play a role in the inhibition of interstitial cysteine proteases.Kidney Function Tests equation is used to measure renal clearance in patientsPatientsIndividuals participating in the health care system for the purpose of receiving therapeutic, diagnostic, or preventive procedures.Clinician–Patient Relationship with low muscle massMassThree-dimensional lesion that occupies a space within the breastImaging of the Breast.
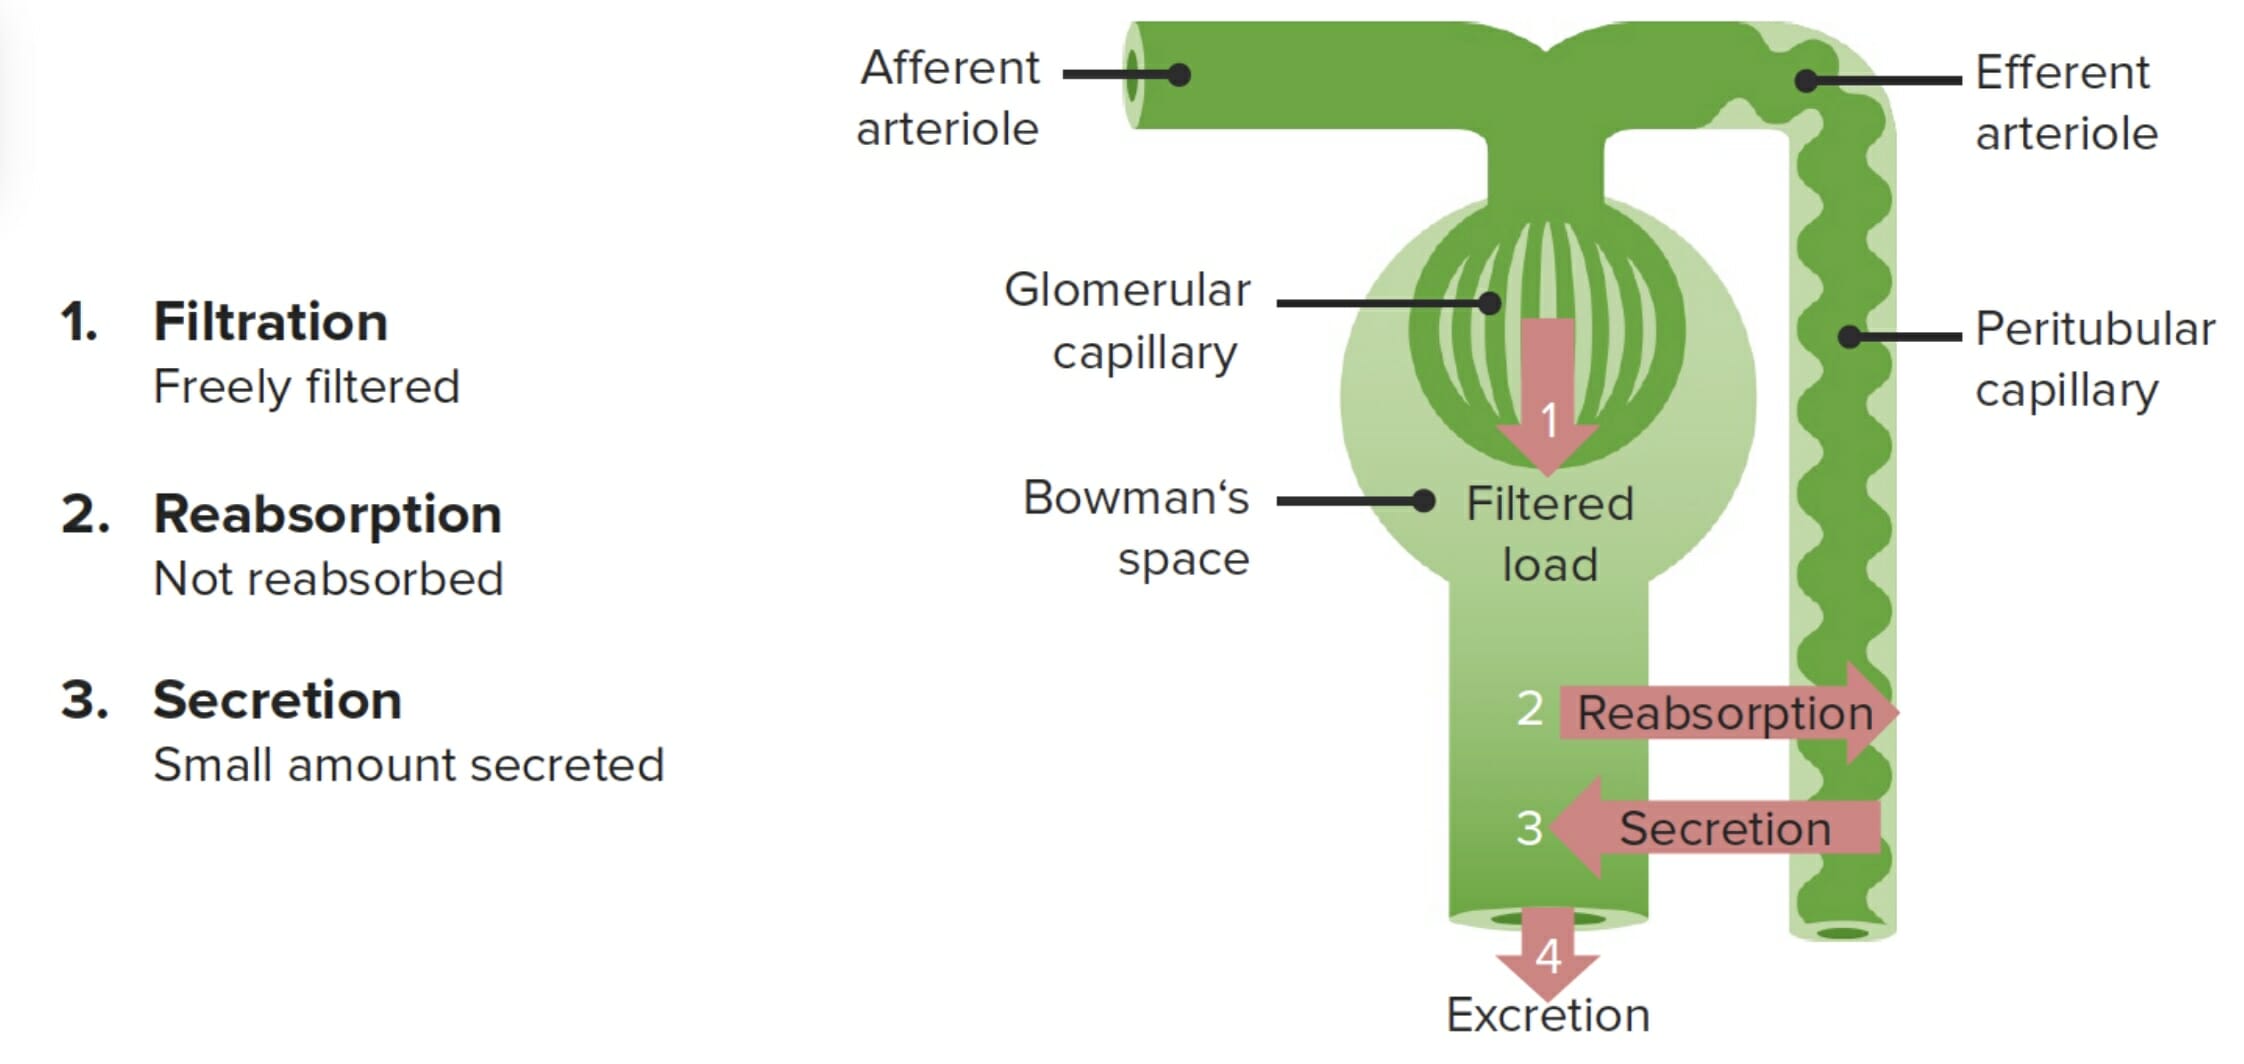
Creatinine is the primary renal filtration marker used clinically to approximate the glomerular filtration rate (GFR): Creatinine is freely filtered and is not reabsorbed. However, creatinine is also secreted from the peritubular capillaries, causing around a 10% overestimation of GFR.
Image by Lecturio.
Biliary excretion
Some drugs are extensively excreted in the bileBileAn emulsifying agent produced in the liver and secreted into the duodenum. Its composition includes bile acids and salts; cholesterol; and electrolytes. It aids digestion of fats in the duodenum.Gallbladder and Biliary Tract: Anatomy.
These drugs undergo active transportActive transportThe movement of materials across cell membranes and epithelial layers against an electrochemical gradient, requiring the expenditure of metabolic energy.The Cell: Cell Membrane against a concentration gradient.
Drugs are more likely to be excreted in bileBileAn emulsifying agent produced in the liver and secreted into the duodenum. Its composition includes bile acids and salts; cholesterol; and electrolytes. It aids digestion of fats in the duodenum.Gallbladder and Biliary Tract: Anatomy if:
They have high molecular weight
They contain polar and lipophilic groups
ConjugationConjugationA parasexual process in bacteria; algae; fungi; and ciliate eukaryota for achieving exchange of chromosome material during fusion of two cells. In bacteria, this is a unidirectional transfer of genetic material; in protozoa it is a bi-directional exchange. In algae and fungi, it is a form of sexual reproduction, with the union of male and female gametes.Bacteriology with glucuronic acid facilitates biliary excretion.
The enterohepatic cycle limits biliary excretion of drugs.
EliminationEliminationThe initial damage and destruction of tumor cells by innate and adaptive immunity. Completion of the phase means no cancer growth. Cancer Immunotherapy kinetics
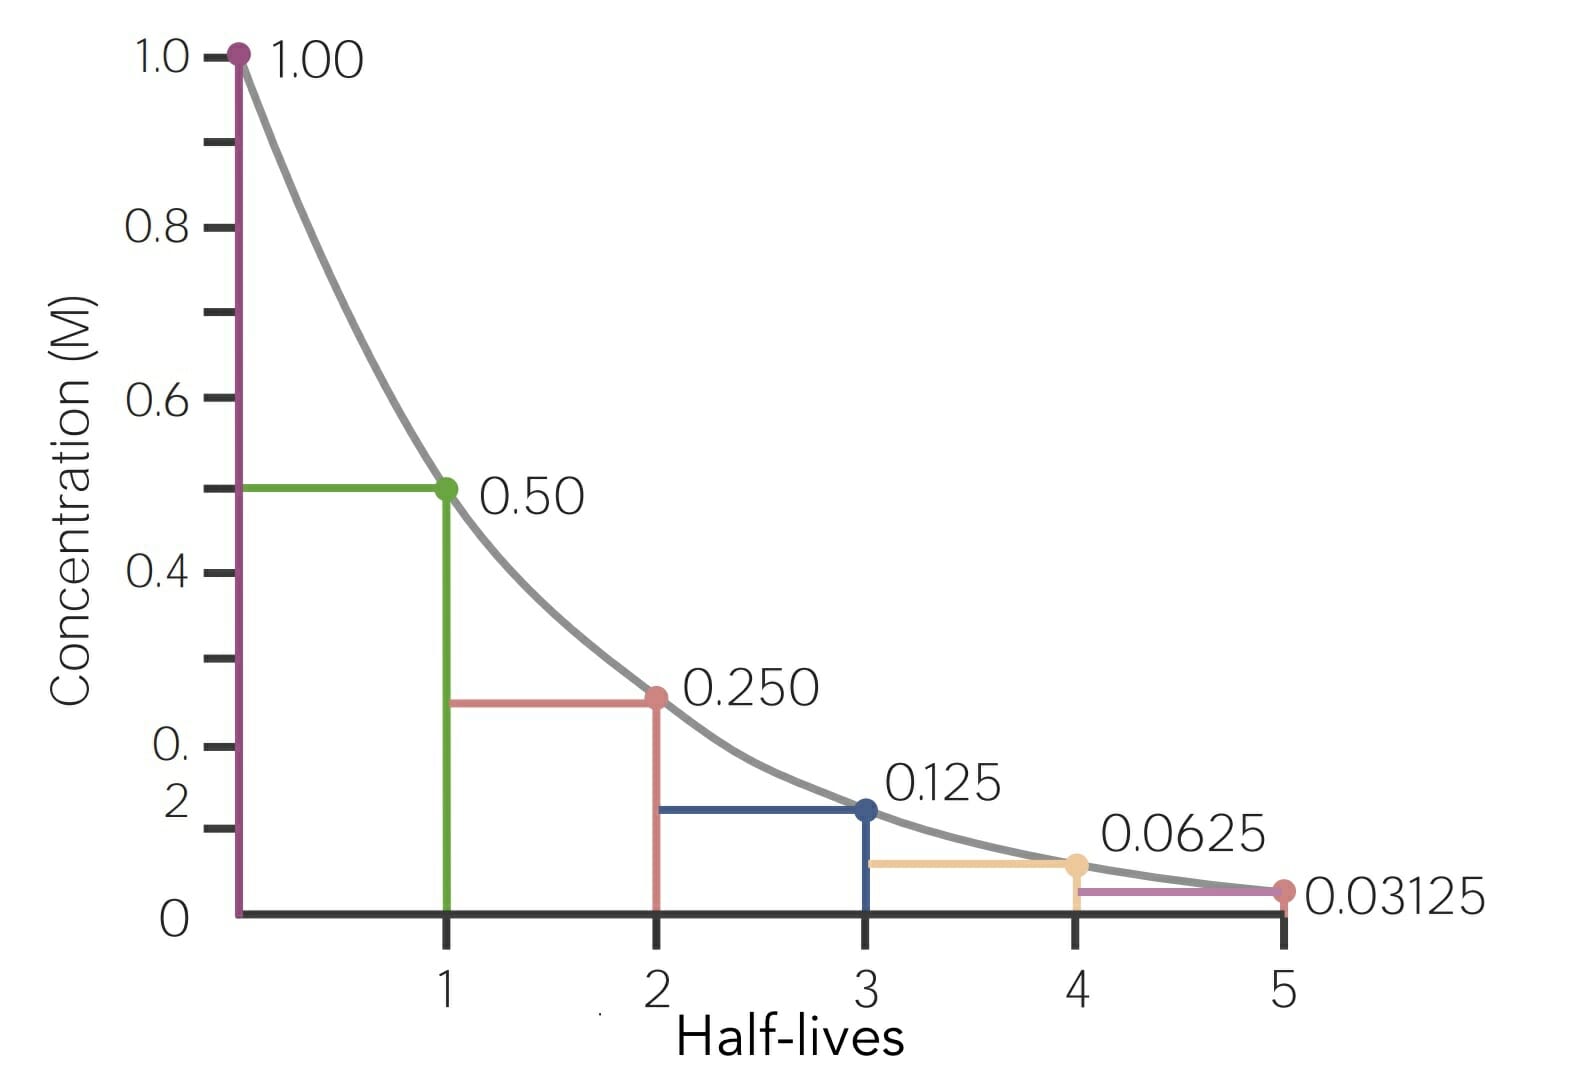
Half-life (T1/2): time (in minutes or hours) required for the plasmaPlasmaThe residual portion of blood that is left after removal of blood cells by centrifugation without prior blood coagulation.Transfusion Products concentration of a drug to decrease by 50% after the completion of drug absorptionAbsorptionAbsorption involves the uptake of nutrient molecules and their transfer from the lumen of the GI tract across the enterocytes and into the interstitial space, where they can be taken up in the venous or lymphatic circulation.Digestion and Absorption and distribution:
In other words, the amount of time it takes to eliminate half the drug
Typically, 5 half-lives are required to fully eliminate a drug
Steady-state:concentration of drug absorbed equals the concentration of drug eliminated
1st-order kinetics:
A constant percentage or fraction of drug is eliminated per unit of time.
The eliminationEliminationThe initial damage and destruction of tumor cells by innate and adaptive immunity. Completion of the phase means no cancer growth. Cancer Immunotherapy is directly proportional to the concentration of the drug.
Also referred to as linear or nonsaturable kinetics
Zero-order kinetics:
A constant quantity of drug is eliminated per unit of time
The eliminationEliminationThe initial damage and destruction of tumor cells by innate and adaptive immunity. Completion of the phase means no cancer growth. Cancer Immunotherapy is independent of the concentration of the drug
Also known as saturable, nonlinear, or concentration-independent kinetics
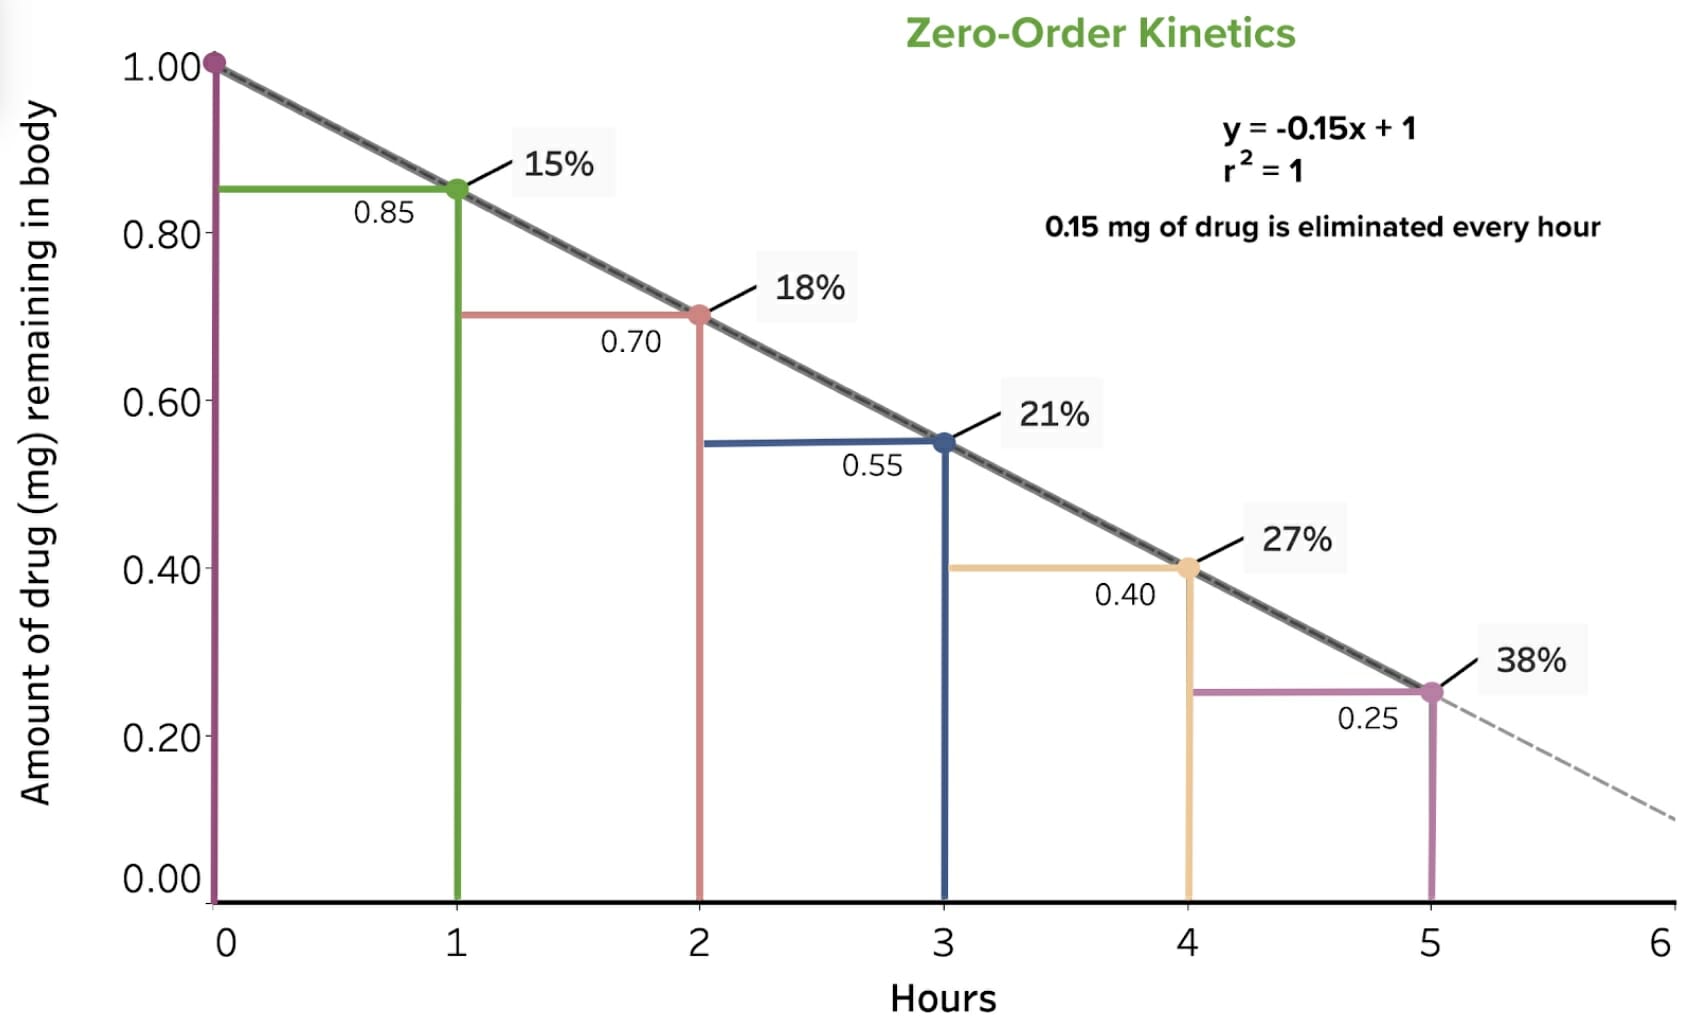
Table: Example of a drug that undergoes zero-order eliminationEliminationThe initial damage and destruction of tumor cells by innate and adaptive immunity. Completion of the phase means no cancer growth. Cancer Immunotherapy kinetics
Hours
Amount of drug (mg/L) remaining in the body
% of drug eliminated
Amount of drug (mg/L) eliminated
0
1
—
—
1
0.85
15
0.15
2
0.70
18
0.15
3
0.55
21
0.15
4
0.40
27
0.15
5
0.25
38
0.15
Note that an equal amount of drug, 0.15 mg/L, is eliminated every hour. Though not shown in the table, at 6 hours there would be an amount of 0.10 mg/L (60%) remaining in the body, which is less than 0.15 mg, so after 6 hours, only the remaining amount of ≤ 0.10 mg is eliminated.
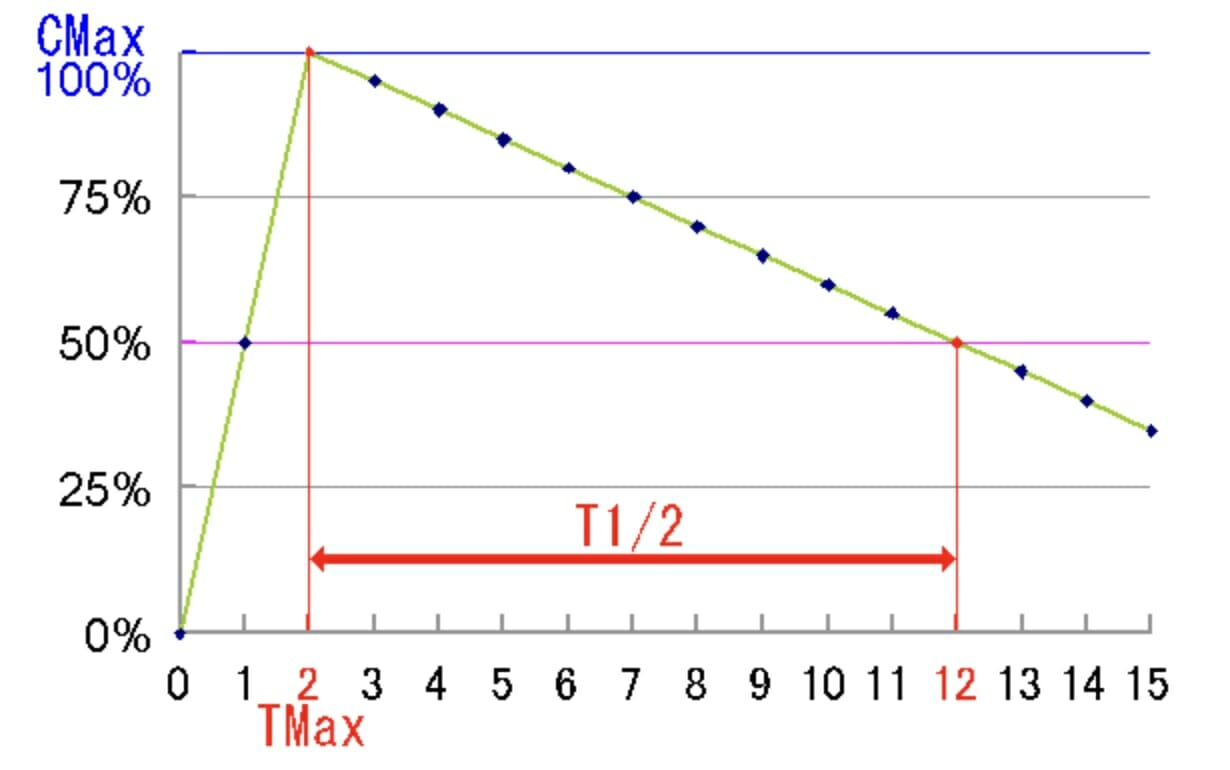
Graphical representation of a drug’s half-life: In this example, the half-life is 10 hours. Cmax = maximal concentration of drug in the bloodstream, Tmax = time at which the concentration of drug in the blood is at it’s maximum. T1/2= half life, the time it takes for the drug level to go from Cmax to ½ of Cmax.
Image: “The example graph medicational half life time” by Tokino. License: Public Domain
Graphical representation of the drug in the table above that undergoes zero-order elimination kinetics: The x-axis is the unit time in hours, and the y-axis is the amount of drug, in milligrams, remaining in the body (or plasma concentration of the drug). At time zero, there is 1.0 mg of drug present, and an equal amount of drug is eliminated every hour—in this example, 0.15 mg.
Image by Lecturio.
Graphical representation example of a drug that undergoes 1st-order elimination kinetics: The x-axis is the unit time in hours, and the y-axis is the amount of drug, in milligrams, remaining in the body (or plasma concentration of the drug). At time zero, there is 1.0 mg of drug present, and then an equal percent/proportion of the drug (in this example, 50%) is eliminated every hour.
Alqahtani, S., & Kaddoumi, A. (2022). Physiologically based pharmacokinetic modeling: Methodology and applications in drug development and regulation. Annual Review of Pharmacology and Toxicology, 62, 63-84. https://pubmed.ncbi.nlm.nih.gov/34633860/
Brunton, L. L., Knollmann, B. C., & Hilal-Dandan, R. (Eds.). (2022). Goodman & Gilman’s the pharmacological basis of therapeutics (14th ed.). McGraw Hill Medical.
Currie, G. M. (2018). Pharmacology, part 1: Introduction to pharmacology and pharmacodynamics. Journal of Nuclear Medicine Technology, 46, 81-86. https://pubmed.ncbi.nlm.nih.gov/29599397/
Dilger, J. P. (2006). From individual to population: The minimum alveolar concentration curve. Current Opinion in Anaesthesiology, 19, 390-396. https://pubmed.ncbi.nlm.nih.gov/16829720/
Feghali, M., Venkataramanan, R., & Caritis, S. (2023). Pharmacokinetics of drugs in pregnancy. Seminars in Perinatology, 47, 151636. https://pubmed.ncbi.nlm.nih.gov/36539344/
Nguyen, T. T. N., Neerukonda, A., Lam, M., & Liu, X. (2023). Advances in understanding drug metabolism in special populations and disease states. Expert Opinion on Drug Metabolism & Toxicology, 19, 215-230. https://pubmed.ncbi.nlm.nih.gov/36696118/
Shahbaz, H., & Gupta, M. (2022). Creatinine clearance. In StatPearls. StatPearls Publishing. Retrieved March 27, 2025, from https://pubmed.ncbi.nlm.nih.gov/31334948/
Smith, D. A., Rowland, M., & Schneider, R. (2022). Pharmacokinetics and metabolism in drug design. Journal of Medicinal Chemistry, 65, 10925-10947. https://pubmed.ncbi.nlm.nih.gov/35969225/
Trevor, A. J., Katzung, B. G., & Kruidering-Hall, M. (2024). Katzung & Trevor’s pharmacology: Examination & board review (16th ed.). McGraw-Hill.
Zhou, W., Johnson, T. N., Xu, H., Cheung, S. Y. A., Bui, K. H., Li, J., Jamei, M., Zhang, H., & Rostami-Hodjegan, A. (2024). Physiologically based pharmacokinetic modeling in pediatric drug development. Clinical Pharmacology & Therapeutics, 115, 366-380. https://pubmed.ncbi.nlm.nih.gov/37460266/
Zhu, A. Z. X. (2024). Application of artificial intelligence in pharmacokinetics and pharmacodynamics. Clinical Pharmacology & Therapeutics, 115, 786-795. https://pubmed.ncbi.nlm.nih.gov/37716462/
Create your free account or log in to continue reading!