The cardiac cycle describes 1 complete contraction and relaxation of all 4 chambers of the heart during a standard heartbeat. The cardiac cycle includes 7 phases, which together describe the cycle of ventricular filling, isovolumetric contraction, ventricular ejection, and isovolumetric relaxation. The cycle is frequently represented in a graph known as a pressure-volume loop, which shows how intraventricular volumes and pressures are related to one another throughout the cardiac cycle.
Last updated: Feb 16, 2026
The cardiac cycle describes 1 complete contraction and relaxation of all 4 chambers of the heart during a standard heartbeat. The 7 phases of the cardiac cycle all occur in < 1 second.
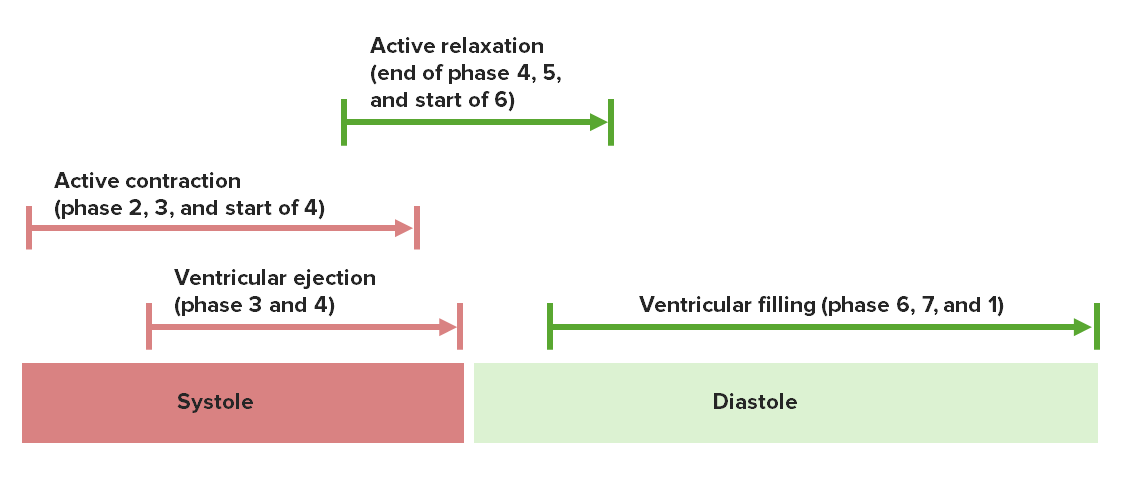
Ventricular systole and diastole, and the coinciding phases of the cardiac cycle
Image by Lecturio.Blood sequentially flows through the heart in 1 direction through the following structures:
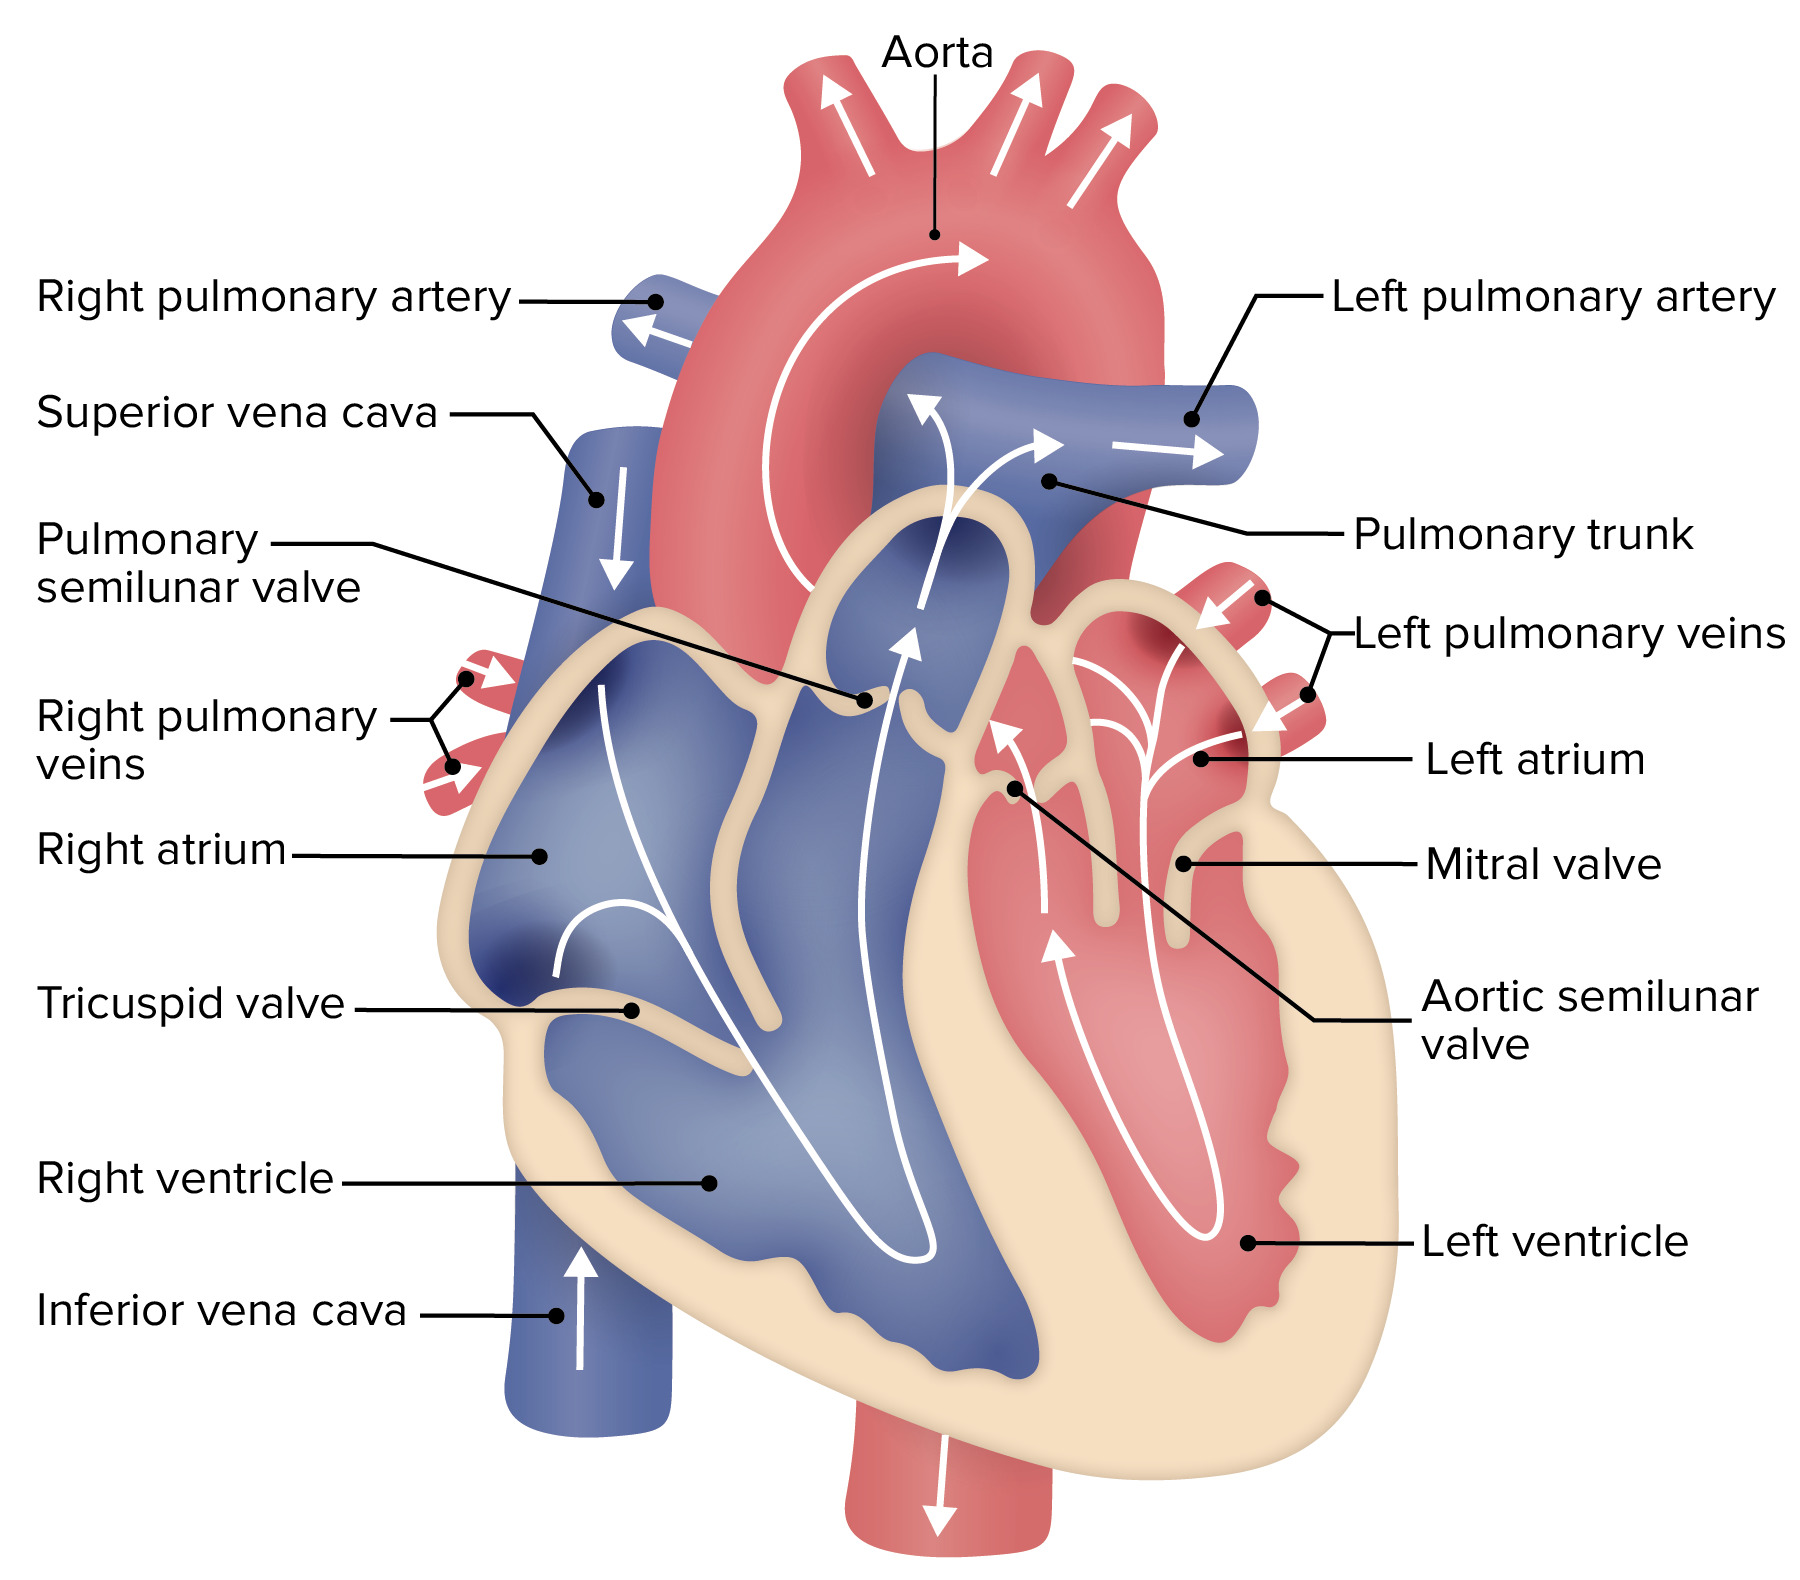
The general structure and flow of blood through the heart:
Blue areas represent deoxygenated blood, which passes through the right side of the heart. Red areas represent oxygenated blood, which passes through the left side of the heart. The right side of the heart pumps the deoxygenated blood to the lungs. The left side of the heart pumps blood out to the systemic arterial system.
Ventricular filling occurs in 3 parts:
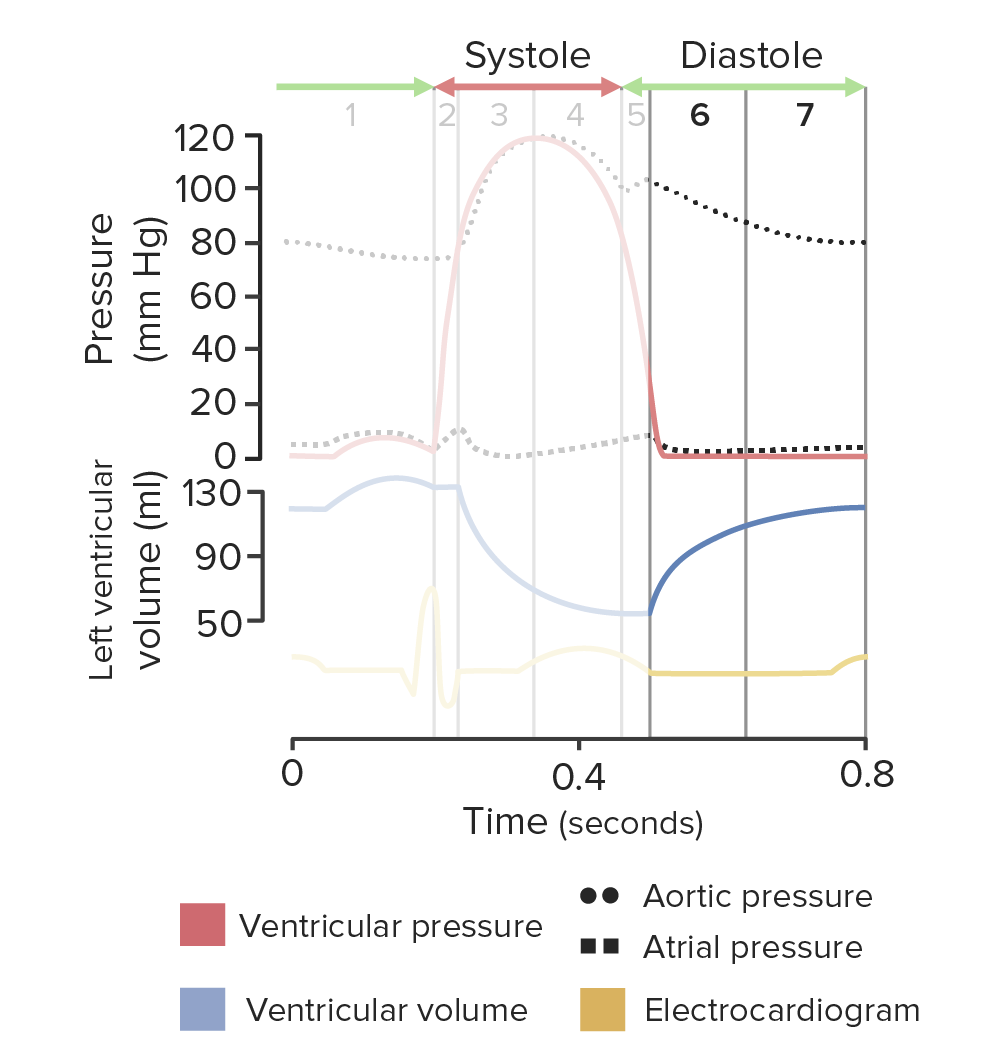
Diagram of the cardiac cycle highlighting phases 6 and 7, ventricular filling:
As the left ventricle (LV) remains relaxed, the left ventricular pressure is less than the pressure in the left atrium (LA). The pressure differential opens the mitral valve and blood begins flowing from the LA into the LV, passively filling the LV. During this time, the left ventricular pressure remains low (red line), but the volume increases (blue line), representing a period of isoelectric activity on the electrocardiogram (yellow line).
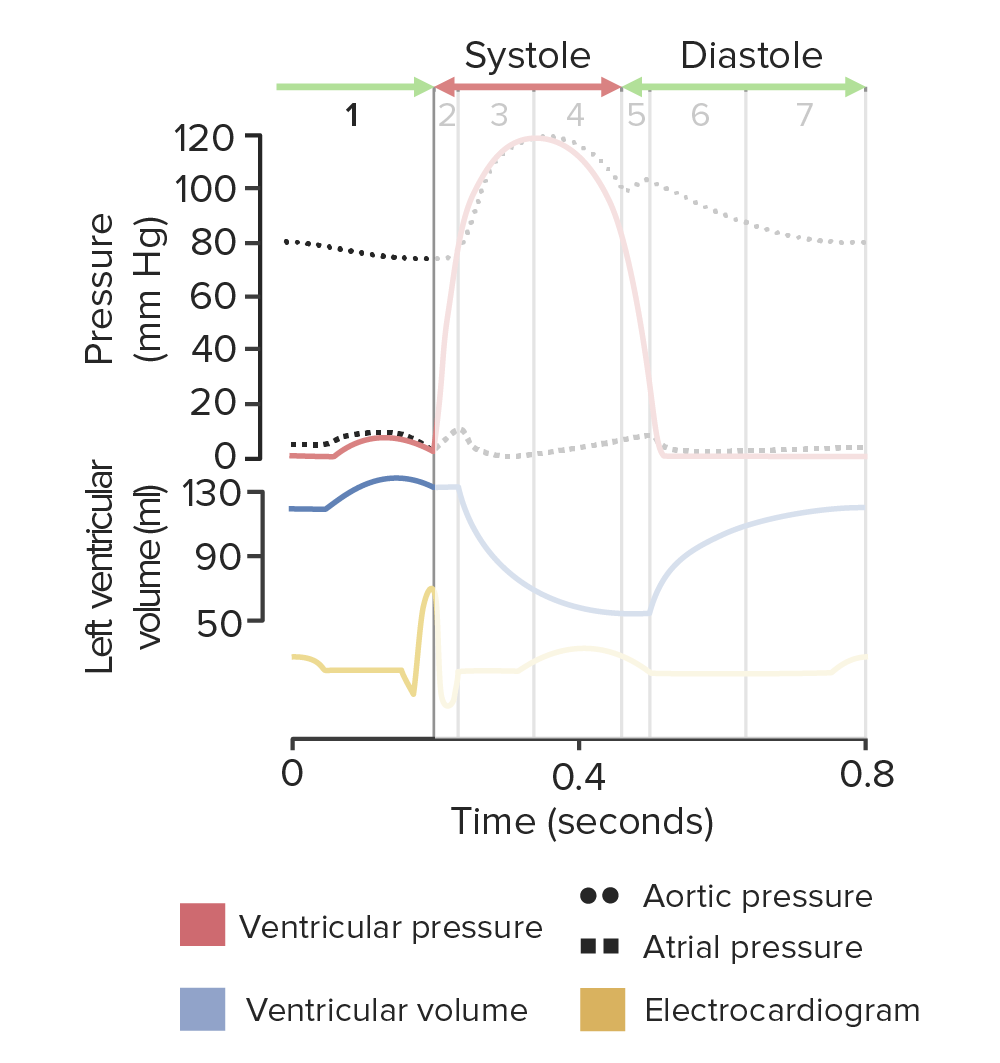
Diagram of the cardiac cycle highlighting phase 1, the active filling phase of the left ventricle (LV):
Atrial pressure (dotted squares) and left ventricular pressure (red line) only slightly increase during atrial systole. Atrial depolarization is represented by the P wave on the electrocardiogram (yellow line). Atrial systole occurs immediately thereafter.
Isovolumetric means “same volume”. Phase 2 Phase 2 Skin: Structure and Functions represents ventricular contraction while both the AV valves and the semilunar valves are closed, which = no change in ventricular volume.
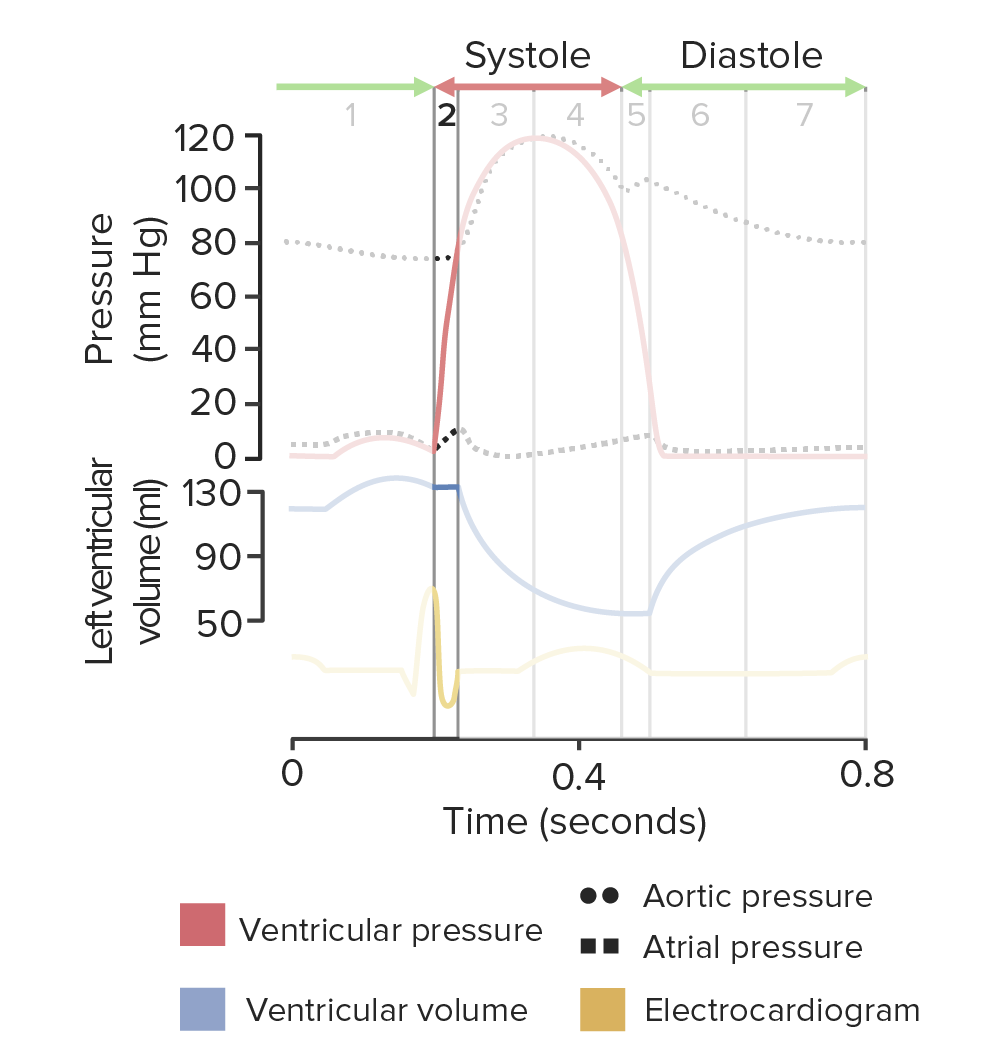
Diagram of the cardiac cycle highlighting phase 2, isovolumetric contraction:
Left ventricular volume (blue) remains the same, but the left ventricular pressure (red) sharply increases, occurring immediately following left ventricular depolarization (seen as the QRS complex on the ECG (yellow line)).
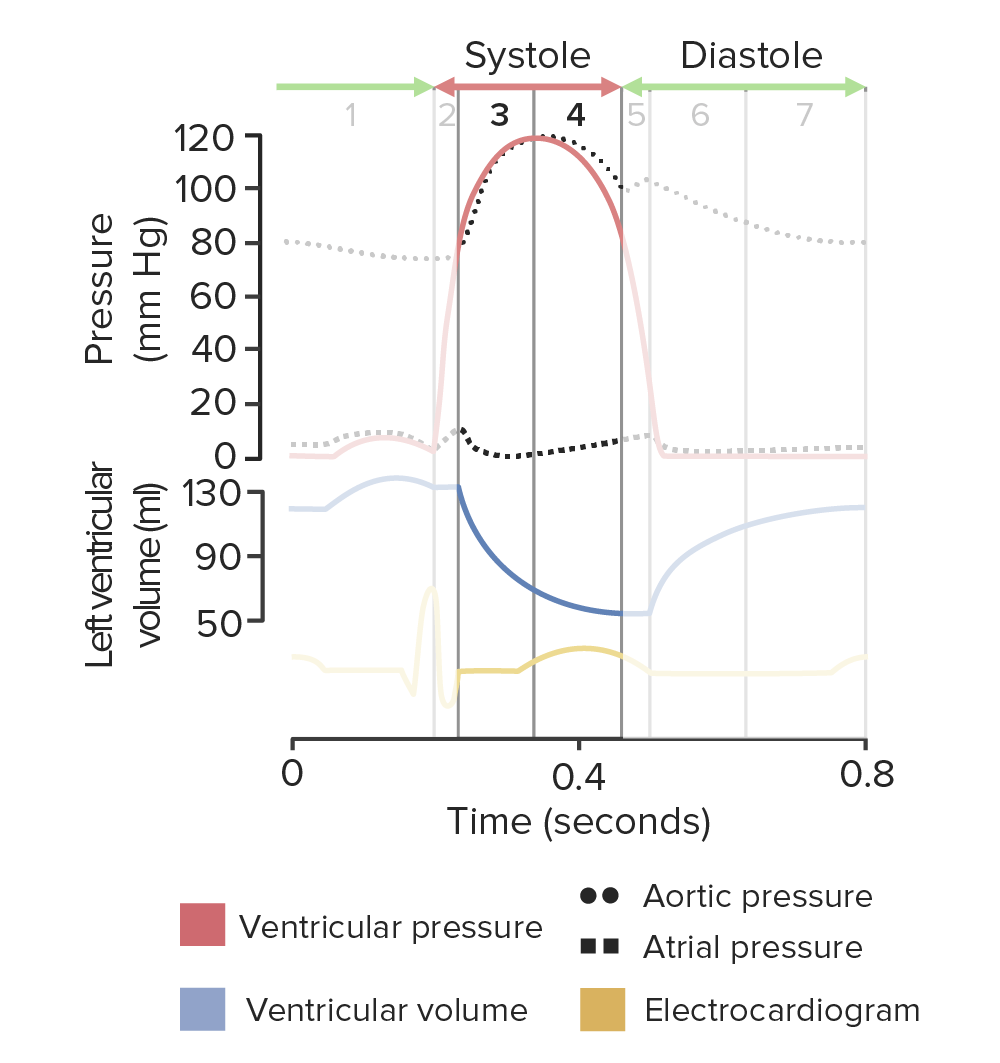
Diagram of the cardiac cycle highlighting phases 3 and 4, ventricular ejection:
As the left ventricle remains contracted, the ventricular pressure (red line) peaks and begins to decrease as blood is ejected out of the ventricle. The phase coincides with the ST segment of the electrocardiogram followed by the T wave of ventricular repolarization (yellow line).
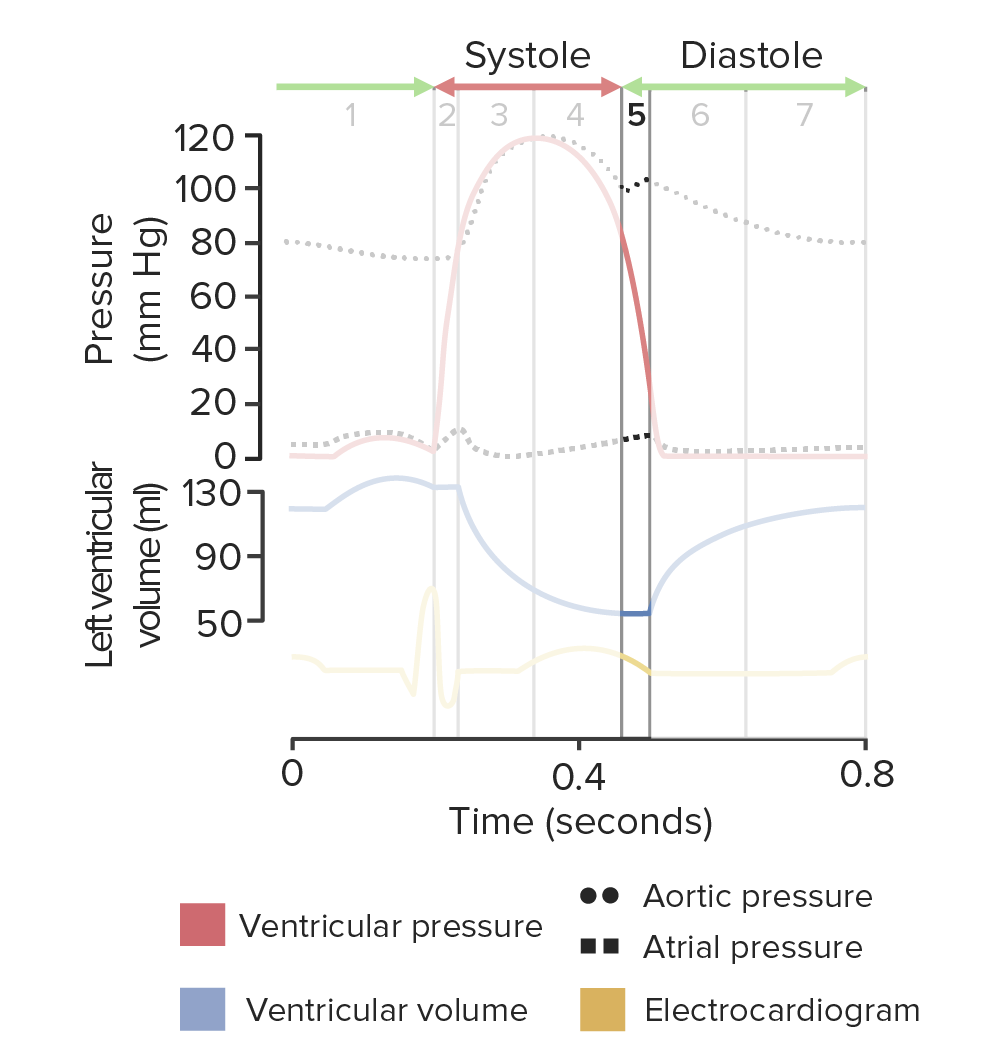
Diagram of the cardiac cycle highlighting phase 5, isovolumetric relaxation:
As the left ventricle begins isovolumetric relaxation, the ventricular pressure sharply drops (red line), but the volume does not change (blue line). The aortic valve closes in response to the pressure differential between the aorta and the left ventricle. Aortic pressure is shown by the top dotted line. The ventricle finishes repolarizing as shown on the electrocardiogram (yellow line).
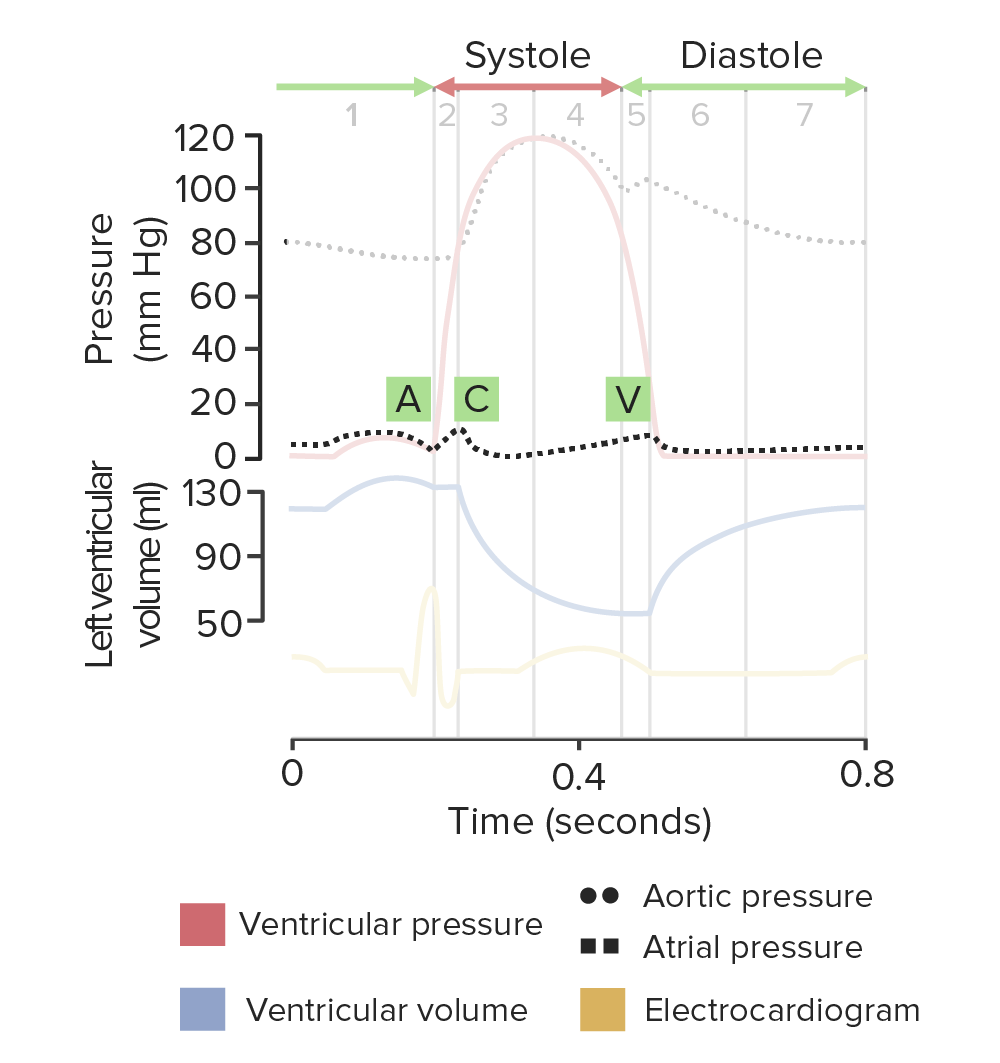
Diagram of the cardiac cycle highlighting the phases of atrial diastole:
Atrial pressure is shown by the lower dotted line. The A wave indicates the increase in atrial pressure during atrial contraction. As the ventricles contract against the closed atrioventricular (AV) valves, the increase in pressure reverberates through the atria as seen in the C wave. The C wave coincides with the isovolumetric contraction of the left ventricle. Atrial relaxation begins during ventricular systole. With the AV valves closed, the atria are passively filled, increasing the atrial pressure. The V wave signifies the sudden fall in atrial pressure when the AV valves open to begin phase 6 (passive ventricular filling).
The normal pressures found in the heart chambers and great vessels during ventricular systole and diastole are shown in the table and image below:
| Location | Pressure during ventricular systole (mm Hg) | Pressure during ventricular diastole (mm Hg) |
|---|---|---|
| Right atrium | 0–4 | 0–4 |
| Right ventricle | 25 | 4 |
| Pulmonary arteries Arteries Arteries are tubular collections of cells that transport oxygenated blood and nutrients from the heart to the tissues of the body. The blood passes through the arteries in order of decreasing luminal diameter, starting in the largest artery (the aorta) and ending in the small arterioles. Arteries are classified into 3 types: large elastic arteries, medium muscular arteries, and small arteries and arterioles. Arteries: Histology | 25 | 10 |
| Left atrium | 8–10 | 8–10 |
| Left ventricle | 120 | 10 |
| Aorta Aorta The main trunk of the systemic arteries. Mediastinum and Great Vessels: Anatomy | 120 | 80 |
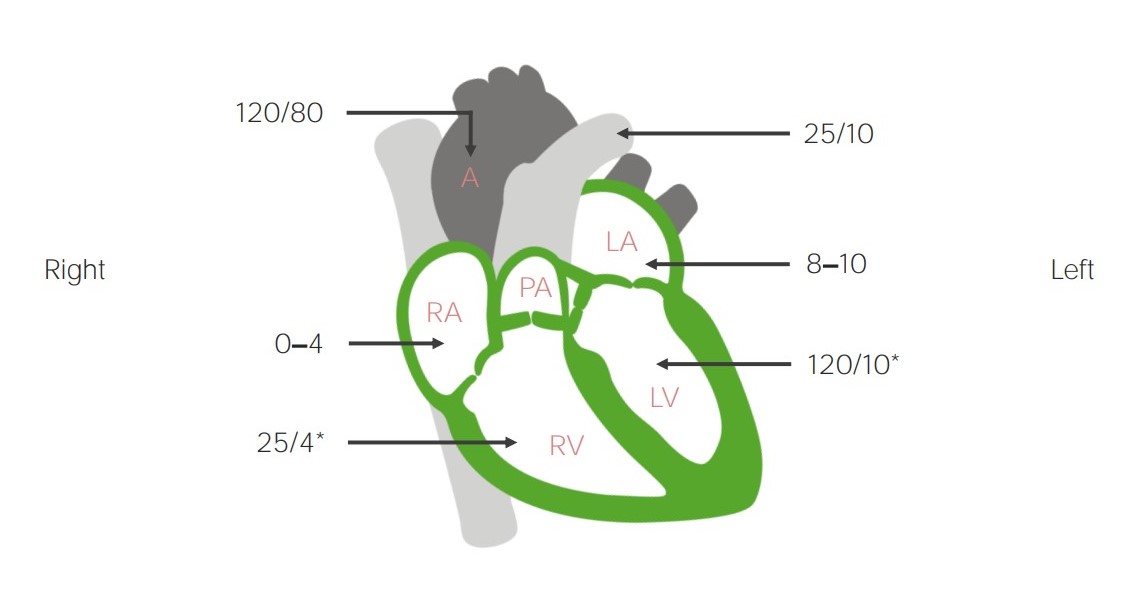
Pressures (in mm Hg) within the chambers of the heart and great vessels:
The numerator represents the highest pressure achieved during systole and the denominator represents the lowest pressure achieved during diastole. Pressure differentials directly cause valve opening and blood movement.
A: aorta
RA: right atrium
PT: pulmonary trunk
LA: left atrium
RV: right ventricle
LV: left ventricle
* denotes end-diastolic pressure

Left ventricular pressure-volume loop:
The diagram illustrates the relationship between left intraventricular pressure and volume throughout the cardiac cycle. The segment from point A to point B represents ventricular filling. The mitral valve opens at point A and closes at point B. The segment from point B to point C represents isovolumetric contraction. The aortic valve opens at point C. The curved line from point C to point D represents ventricular ejection. The aortic valve closes at point D. The segment from point D to point A represents isovolumetric relaxation.
The following are common conditions affecting the cardiac cycle.