Statistical power is the probabilityProbabilityProbability is a mathematical tool used to study randomness and provide predictions about the likelihood of something happening. There are several basic rules of probability that can be used to help determine the probability of multiple events happening together, separately, or sequentially.Basics of Probability of detecting an effect when that effect genuinely exists in the population. Other things being equal, a test based on a large sample has more statistical power than a test involving a small sample. There are also ways to increase power without increasing the sample size. Most published studies have low statistical power, which can lead to serious misinterpretation of results.
Statistical power (SP) is expressed in 3 different ways:
SP is the probabilityProbabilityProbability is a mathematical tool used to study randomness and provide predictions about the likelihood of something happening. There are several basic rules of probability that can be used to help determine the probability of multiple events happening together, separately, or sequentially.Basics of Probability of finding significance if the alternative hypothesisAlternative hypothesisThe alternative hypothesis (H1) states that there is a difference between the populations being studied.Statistical Tests and Data Representation is true.
SP is the probabilityProbabilityProbability is a mathematical tool used to study randomness and provide predictions about the likelihood of something happening. There are several basic rules of probability that can be used to help determine the probability of multiple events happening together, separately, or sequentially.Basics of Probability of correctly rejecting a false null hypothesisNull hypothesisThe null hypothesis (H0) states that there is no difference between the populations being studied (or put another way, there is no relationship between the variables being tested).Statistical Tests and Data Representation, where the null hypothesisNull hypothesisThe null hypothesis (H0) states that there is no difference between the populations being studied (or put another way, there is no relationship between the variables being tested).Statistical Tests and Data Representation is the hypothesisHypothesisA hypothesis is a preliminary answer to a research question (i.e., a “guess” about what the results will be). There are 2 types of hypotheses: the null hypothesis and the alternative hypothesis.Statistical Tests and Data Representation that there is no significant difference between specified populations (e.g., control versus experimental groups).
SP = 1 – beta (β), where β = type II (false negativeFalse negativeAn FN test result indicates a person does not have the disease when, in fact, they do.Epidemiological Values of Diagnostic Tests) errorErrorRefers to any act of commission (doing something wrong) or omission (failing to do something right) that exposes patients to potentially hazardous situations.Disclosure of Information, equivalent to 1 – sensitivity. The more powerful a clinical experimental study, the more readily it will detect a treatment effect when it really exists.
Low statistical power
Fewer than 13% of 31,873 clinical trials published between 1974 and 2017 had adequate SP. A study with low SP means that the test results are questionable and poses potentially serious problems, including:
A reduced chance of detecting a true, genuine, and meaningful effect in the sample population, which may block the pursuit of further studies
Lower likelihood that a statistically significant result reflects a true effect (e.g., more false positives)
Overestimation of the true treatment effect size (ES)
Low reproducibility
Possible violation of ethical principles:
PatientsPatientsIndividuals participating in the health care system for the purpose of receiving therapeutic, diagnostic, or preventive procedures.Clinician–Patient Relationship and healthy volunteers continue to participate in researchResearchCritical and exhaustive investigation or experimentation, having for its aim the discovery of new facts and their correct interpretation, the revision of accepted conclusions, theories, or laws in the light of newly discovered facts, or the practical application of such new or revised conclusions, theories, or laws.Conflict of Interest that may be of limited clinical value.
Unnecessary sacrifice of researchResearchCritical and exhaustive investigation or experimentation, having for its aim the discovery of new facts and their correct interpretation, the revision of accepted conclusions, theories, or laws in the light of newly discovered facts, or the practical application of such new or revised conclusions, theories, or laws.Conflict of InterestanimalsAnimalsUnicellular or multicellular, heterotrophic organisms, that have sensation and the power of voluntary movement. Under the older five kingdom paradigm, animalia was one of the kingdoms. Under the modern three domain model, animalia represents one of the many groups in the domain eukaryota.Cell Types: Eukaryotic versus Prokaryotic
Chaos in the interpretation of small-sample studies using the same methodology but which produce conflicting results
Too much statistical power: overpowered studies
Studies having too much SP, also called “overpowered studies,” can also be problematic because of the following reasons:
Can be misleading as they have the potential to show statistical significanceStatistical significanceStatistical significance is the idea that all test outcomes are highly unlikely to be produced simply by chance.Statistical Tests and Data Representation and also unimportant/irrelevant clinical differences
Result in wastage of resources
May be unethical due to the involvement of human subjects and/or laboratory animalsAnimalsUnicellular or multicellular, heterotrophic organisms, that have sensation and the power of voluntary movement. Under the older five kingdom paradigm, animalia was one of the kingdoms. Under the modern three domain model, animalia represents one of the many groups in the domain eukaryota.Cell Types: Eukaryotic versus Prokaryotic for unnecessary experiments
Characteristics
Statistical power has relevance only when the null hypothesisNull hypothesisThe null hypothesis (H0) states that there is no difference between the populations being studied (or put another way, there is no relationship between the variables being tested).Statistical Tests and Data Representation can be rejected, and is determined by the following variables:
Alpha is the chance of testing positive by a diagnostic test among those without the condition, causing a type I errorErrorRefers to any act of commission (doing something wrong) or omission (failing to do something right) that exposes patients to potentially hazardous situations.Disclosure of Information or a “false positiveFalse positiveAn FP test result indicates that a person has the disease when they do not.Epidemiological Values of Diagnostic Tests.”
Alpha = the chance of rejecting the null hypothesisNull hypothesisThe null hypothesis (H0) states that there is no difference between the populations being studied (or put another way, there is no relationship between the variables being tested).Statistical Tests and Data Representation among those that satisfy the null hypothesisNull hypothesisThe null hypothesis (H0) states that there is no difference between the populations being studied (or put another way, there is no relationship between the variables being tested).Statistical Tests and Data Representation
Alpha = 1 – specificity = “p-valueP-valueThe p-value is the probability of obtaining a given result, assuming the null hypothesis is true.Statistical Tests and Data Representation” = “the significance level”
At a significance (alpha) level of 0.05, 5% of the samples may show a false significant difference due just to chance.
Most studies use an alpha cut-off of 5% (0.05).
Beta
Beta is the chance of testing negative by a diagnostic test among those with the condition, causing a type II errorErrorRefers to any act of commission (doing something wrong) or omission (failing to do something right) that exposes patients to potentially hazardous situations.Disclosure of Information or a “false negativeFalse negativeAn FN test result indicates a person does not have the disease when, in fact, they do.Epidemiological Values of Diagnostic Tests.”
Beta = the chance of accepting the null hypothesisNull hypothesisThe null hypothesis (H0) states that there is no difference between the populations being studied (or put another way, there is no relationship between the variables being tested).Statistical Tests and Data Representation among those that do not satisfy the null hypothesisNull hypothesisThe null hypothesis (H0) states that there is no difference between the populations being studied (or put another way, there is no relationship between the variables being tested).Statistical Tests and Data Representation
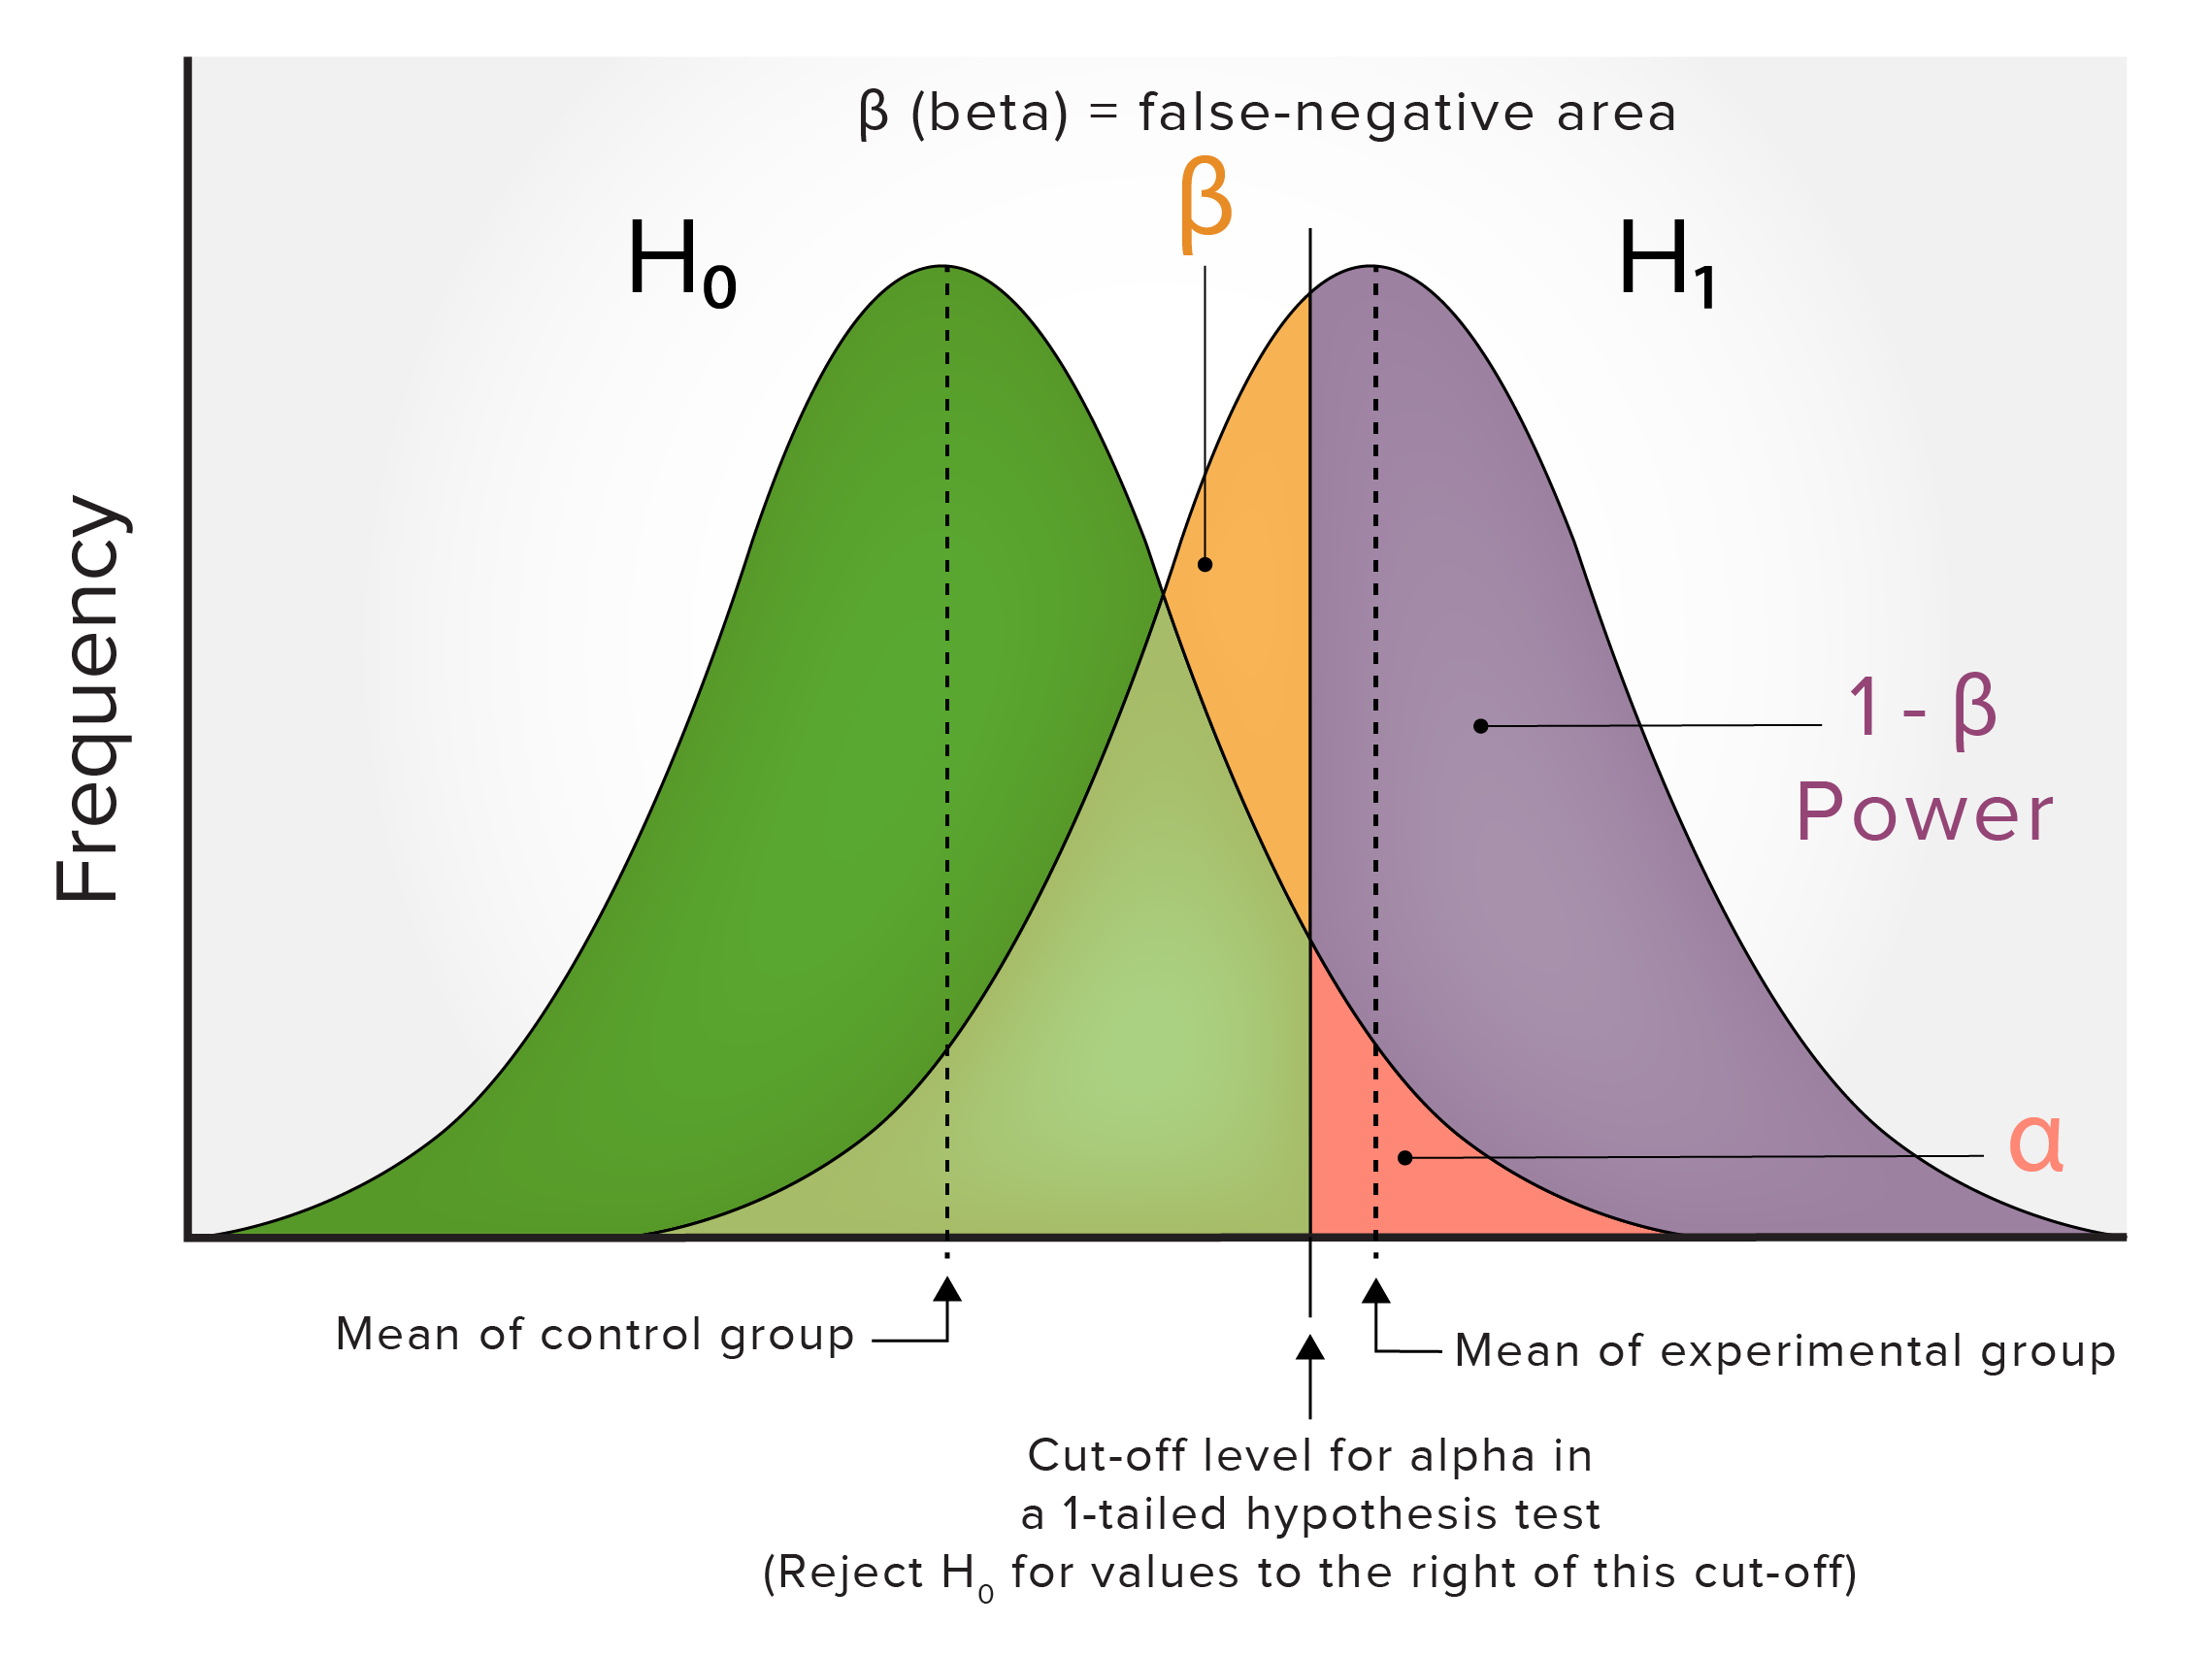
The relationshipRelationshipA connection, association, or involvement between 2 or more parties.Clinician–Patient Relationship between alpha and beta is often depicted in graphs that show:
2 normalized populations or distributions:
A control group
An experimental group (which may have a statistically significant, different meanMeanMean is the sum of all measurements in a data set divided by the number of measurements in that data set.Measures of Central Tendency and Dispersion)
H0: the null hypothesisNull hypothesisThe null hypothesis (H0) states that there is no difference between the populations being studied (or put another way, there is no relationship between the variables being tested).Statistical Tests and Data Representation, which states that there is only 1 true meanMeanMean is the sum of all measurements in a data set divided by the number of measurements in that data set.Measures of Central Tendency and Dispersion (of the control group) and that any variation found in the sample/experimental group is only due to normal random variation in distribution
H1: the alternative hypothesisAlternative hypothesisThe alternative hypothesis (H1) states that there is a difference between the populations being studied.Statistical Tests and Data Representation, which is a statement that directly contradicts the null hypothesisNull hypothesisThe null hypothesis (H0) states that there is no difference between the populations being studied (or put another way, there is no relationship between the variables being tested).Statistical Tests and Data Representation by stating that the actual value of a population parameter is less than or greater than the value stated in the null hypothesisNull hypothesisThe null hypothesis (H0) states that there is no difference between the populations being studied (or put another way, there is no relationship between the variables being tested).Statistical Tests and Data Representation
Alpha (α): the false-positive area (usually shown as a 2-tailed hypothesisHypothesisA hypothesis is a preliminary answer to a research question (i.e., a “guess” about what the results will be). There are 2 types of hypotheses: the null hypothesis and the alternative hypothesis.Statistical Tests and Data Representation test)
This is a graph of 2 normalized populations or distributions of a control group (green) and an experimental group (purple) with a statistically significant different mean. See the text for explanations of the symbols used.
There is an inverse relationshipRelationshipA connection, association, or involvement between 2 or more parties.Clinician–Patient Relationship between alpha and beta. If beta is decreased:
The area of alpha would increase.
The number of false negatives or type II errors would decrease.
The number of false positives or type I errors would increase.
The inverse relationshipRelationshipA connection, association, or involvement between 2 or more parties.Clinician–Patient Relationship of alpha and beta can also be appreciated in a 2 x 2 contingency tableContingency tableA contingency table lists the frequency distributions of variables from a study and is a convenient way to look at any relationships between variables.Measures of Risk that compares the positive and negative findings of reality versus a study.
Real positive findings
Real negative findings
Positive study findings
True positives (power, 1 – β)
False positives (type I errorErrorRefers to any act of commission (doing something wrong) or omission (failing to do something right) that exposes patients to potentially hazardous situations.Disclosure of Information, α)
Negative study findings
False negatives (type II errorErrorRefers to any act of commission (doing something wrong) or omission (failing to do something right) that exposes patients to potentially hazardous situations.Disclosure of Information, β)
Standard deviationStandard deviationThe standard deviation (SD) is a measure of how far each observed value is from the mean in a data set.Measures of Central Tendency and Dispersion is a measure of the amount of variation or dispersionDispersionCentral tendency is a measure of values in a sample that identifies the different central points in the data, often referred to colloquially as “averages.” The most common measurements of central tendency are the mean, median, and mode. Identifying the central value allows other values to be compared to it, showing the spread or cluster of the sample, which is known as the dispersion or distribution. Measures of Central Tendency and Dispersion of a set of values relative to the meanMeanMean is the sum of all measurements in a data set divided by the number of measurements in that data set.Measures of Central Tendency and Dispersion.
Calculated as the square root of the variance, which is the average of the squared differences from the meanMeanMean is the sum of all measurements in a data set divided by the number of measurements in that data set.Measures of Central Tendency and Dispersion.
The higher the SDSDThe standard deviation (SD) is a measure of how far each observed value is from the mean in a data set.Measures of Central Tendency and Dispersion, the more patientsPatientsIndividuals participating in the health care system for the purpose of receiving therapeutic, diagnostic, or preventive procedures.Clinician–Patient Relationship are needed in a sample to demonstrate a statistically significant difference.
Sample size
The sample size is the number of observations in a sample.
A larger sample will better represent the population; thus, the power of the test will naturally increase.
Most commonly used parameter to increase the power of a study
For a 2 sample, 2-tailed t-test with an alpha level of 0.05, the simple formula below will give an approximate sample size needed to have a statistical power of 80% (beta = 0.2):
$$ n = \frac{16s^{2}}{d^{2}} $$
where n = size of each sample, s = standard deviationStandard deviationThe standard deviation (SD) is a measure of how far each observed value is from the mean in a data set.Measures of Central Tendency and Dispersion (assumed to be the same in each group), and d = difference to be detected. The mnemonic, as suggested by the originator of the formula, Robert Lehr, is “16 s-squared over d-squared.” (Note: “s-squared” is also known as the variance).
Examples:
Find the approximate number of patientsPatientsIndividuals participating in the health care system for the purpose of receiving therapeutic, diagnostic, or preventive procedures.Clinician–Patient Relationship with Stage I hypertensionHypertensionHypertension, or high blood pressure, is a common disease that manifests as elevated systemic arterial pressures. Hypertension is most often asymptomatic and is found incidentally as part of a routine physical examination or during triage for an unrelated medical encounter. Hypertension (systolic 130–139 mmMMMultiple myeloma (MM) is a malignant condition of plasma cells (activated B lymphocytes) primarily seen in the elderly. Monoclonal proliferation of plasma cells results in cytokine-driven osteoclastic activity and excessive secretion of IgG antibodies.Multiple Myeloma Hg or diastolic 80–89 mmMMMultiple myeloma (MM) is a malignant condition of plasma cells (activated B lymphocytes) primarily seen in the elderly. Monoclonal proliferation of plasma cells results in cytokine-driven osteoclastic activity and excessive secretion of IgG antibodies.Multiple Myeloma Hg) needed to provide 80% power to detect a 15-mm Hg difference in diastolic BP treatments A and B using a 2-sample, 2-tailed, alpha = 0.05 t-test, given that the expected standard deviationStandard deviationThe standard deviation (SD) is a measure of how far each observed value is from the mean in a data set.Measures of Central Tendency and Dispersion for each group is 15 mmMMMultiple myeloma (MM) is a malignant condition of plasma cells (activated B lymphocytes) primarily seen in the elderly. Monoclonal proliferation of plasma cells results in cytokine-driven osteoclastic activity and excessive secretion of IgG antibodies.Multiple Myeloma Hg. Answer: The approximate sample size n = “16 s-squared over d-squared” = 16 x 152/152 = 16 x 225/225 = 16 people in each group. Note that one of the “treatments” is usually set as the control (not treated) group.
To turn it around: In 2 groups with 16 patientsPatientsIndividuals participating in the health care system for the purpose of receiving therapeutic, diagnostic, or preventive procedures.Clinician–Patient Relationship each with Stage I hypertensionHypertensionHypertension, or high blood pressure, is a common disease that manifests as elevated systemic arterial pressures. Hypertension is most often asymptomatic and is found incidentally as part of a routine physical examination or during triage for an unrelated medical encounter. Hypertension, a treatment difference of 15 mmMMMultiple myeloma (MM) is a malignant condition of plasma cells (activated B lymphocytes) primarily seen in the elderly. Monoclonal proliferation of plasma cells results in cytokine-driven osteoclastic activity and excessive secretion of IgG antibodies.Multiple Myeloma Hg was found after the patientsPatientsIndividuals participating in the health care system for the purpose of receiving therapeutic, diagnostic, or preventive procedures.Clinician–Patient Relationship in each group were treated with 2 different treatments. If alpha = 0.05 and beta = 0.2, was the sample size sufficient to detect a significant difference? Answer: n = 16 x 152/152 = 16 people in each group. So, yes, the sample size was sufficient.
In question 1, what would be the approximate number of patientsPatientsIndividuals participating in the health care system for the purpose of receiving therapeutic, diagnostic, or preventive procedures.Clinician–Patient Relationship needed, if the investigator wanted to detect a 7.5-mm Hg difference instead of a 15-mm Hg difference, with all other parameters remaining the same? Answer: n = 16 x 152/7.52 = 16 x 225/56.25 = 64 people in each group In this last example, note that in order to detect half as big a difference you need 4 times the sample size, which is made evident by the simple formula.
Treatment effect size
Effect size is the standardized meanMeanMean is the sum of all measurements in a data set divided by the number of measurements in that data set.Measures of Central Tendency and Dispersion difference between 2 groups, which is exactly equivalent to the “Z-scoreZ-scoreStandard deviation difference between patient’s bone mass density and that of age-matched population.Osteoporosis” of a standard normal distribution.
If the difference between the 2 treatments is small, more patientsPatientsIndividuals participating in the health care system for the purpose of receiving therapeutic, diagnostic, or preventive procedures.Clinician–Patient Relationship will be required to detect a difference.
Other situations that have ESs:
The correlationCorrelationDetermination of whether or not two variables are correlated. This means to study whether an increase or decrease in one variable corresponds to an increase or decrease in the other variable.Causality, Validity, and Reliability between 2 variables
Cohen’s d is the most common (but imperfect) method to calculate ES. Cohen’s d = the estimated difference in the means/(pooled estimated standard deviations), where:
$$ {SD = \sqrt{\frac{(SD1^{2} + SD2^{2})}{2}}} $$
If the SDs are equal in each group, then d = meanMeanMean is the sum of all measurements in a data set divided by the number of measurements in that data set.Measures of Central Tendency and Dispersion differences/SDSDThe standard deviation (SD) is a measure of how far each observed value is from the mean in a data set.Measures of Central Tendency and Dispersion. For example, if the difference is 150 and the SDSDThe standard deviation (SD) is a measure of how far each observed value is from the mean in a data set.Measures of Central Tendency and Dispersion is 50, then d = 150/50 = 3, which is a large ES.
Interpretation of Cohen’s d:
Small ES: If d = 0.2, the score or value of the average subject in the experimental group is 0.2 SDs above the value of the average subject in the control group, exceeding the values of 58% of the control group.
Medium ES: If d = 0.5, the value of the average subject in the experimental group is 0.5 SDs above the value of the average subject in the control group, exceeding the values of 69% of the control group.
Large ES: If d = 0.8, the value of the average subject is 0.8 SDs above the value of the average subject in the control group, exceeding the values of 79% of the control group.
Summary of characteristics
In summary, the SP will tend to be greater when:
ES (difference between groups) is large.
Sample size is large.
SDs of the populations are small.
Alpha significance level is higher (e.g., 0.05 rather than 0.01).
Beta cut-off is low (e.g., 0.1 versus 0.2).
1-tailed test rather than a 2-tailed test is used.
However, the directional hypothesisHypothesisA hypothesis is a preliminary answer to a research question (i.e., a “guess” about what the results will be). There are 2 types of hypotheses: the null hypothesis and the alternative hypothesis.Statistical Tests and Data Representation cannot detect a difference that is in the opposite direction.
This test is rarely used.
Common Mistakes
Rejecting a null hypothesisNull hypothesisThe null hypothesis (H0) states that there is no difference between the populations being studied (or put another way, there is no relationship between the variables being tested).Statistical Tests and Data Representation (e.g., there is a significant difference) without considering the practical/clinical significance of the study finding
Accepting a null hypothesisNull hypothesisThe null hypothesis (H0) states that there is no difference between the populations being studied (or put another way, there is no relationship between the variables being tested).Statistical Tests and Data Representation (e.g., not rejecting a null hypothesisNull hypothesisThe null hypothesis (H0) states that there is no difference between the populations being studied (or put another way, there is no relationship between the variables being tested).Statistical Tests and Data Representation) when a result is NOT statistically significant, without taking power into account
Being convinced by a researchResearchCritical and exhaustive investigation or experimentation, having for its aim the discovery of new facts and their correct interpretation, the revision of accepted conclusions, theories, or laws in the light of newly discovered facts, or the practical application of such new or revised conclusions, theories, or laws.Conflict of Interest study with low power
Neglecting to perform a power analysis/sample size calculation
Not correcting for multiple inference when calculating power:
Multiple inference is the process of performing more than 1 statistical inference test on the same data set.
Running multiple tests on the same data set at the same stage of analysis increases the chance of obtaining at least 1 invalid result.
Using standardized ESs (e.g., the small, medium, and large ESs of Cohen’s d) rather than considering the details of the experimental design itself. An experiment can sometimes have a small Cohen rating but be a better experiment.
Confusing retrospective power (calculated after data are collected) and prospective power
Analysis
A power analysis answers 2 big questions:
How much SP is considered adequate?
How big of a sample size will be needed?
How much statistical power is considered adequate?
The traditional minimum level of power is 80% (or 0.80), just as the arbitrary 5% (or 0.05) value is the traditional minimum alpha cut-off to set the p-valueP-valueThe p-value is the probability of obtaining a given result, assuming the null hypothesis is true.Statistical Tests and Data Representation at 0.05.
An 80% power level means there is a 20% probabilityProbabilityProbability is a mathematical tool used to study randomness and provide predictions about the likelihood of something happening. There are several basic rules of probability that can be used to help determine the probability of multiple events happening together, separately, or sequentially.Basics of Probability of encountering a type II errorErrorRefers to any act of commission (doing something wrong) or omission (failing to do something right) that exposes patients to potentially hazardous situations.Disclosure of Information (false negativeFalse negativeAn FN test result indicates a person does not have the disease when, in fact, they do.Epidemiological Values of Diagnostic Tests).
This 20% acceptable level of having type II errors is 4 times higher than the 5% likelihood of encountering a type I errorErrorRefers to any act of commission (doing something wrong) or omission (failing to do something right) that exposes patients to potentially hazardous situations.Disclosure of Information (false positiveFalse positiveAn FP test result indicates that a person has the disease when they do not.Epidemiological Values of Diagnostic Tests) for the standard value for the significance level.
Type I errors are generally considered worse than type II errors.
It would be much better to have a 90% power level. Although it takes more resources, keep in mind that it would take even more to rerun the study later.
How big of a sample size will be needed?
A sample large enough to detect an effect of practical scientific importance to ensure a probabilityProbabilityProbability is a mathematical tool used to study randomness and provide predictions about the likelihood of something happening. There are several basic rules of probability that can be used to help determine the probability of multiple events happening together, separately, or sequentially.Basics of Probability high enough such that a false null hypothesisNull hypothesisThe null hypothesis (H0) states that there is no difference between the populations being studied (or put another way, there is no relationship between the variables being tested).Statistical Tests and Data Representation is rejected
Power analysis must be performed before an experiment is started.
One cannot continue to add subjects to a completed experiment that had a nearly significant p-valueP-valueThe p-value is the probability of obtaining a given result, assuming the null hypothesis is true.Statistical Tests and Data Representation.
This practice is frowned upon and constitutes what is called “p-hacking” or “data-dredging.”
Calculating the proper sample size for an independent samples t-test:
Estimate (by pilot study or historical data) the population means of the 2 groups or the difference between the means, which should be the smallest ES that is of scientific interest.
Estimate (by pilot study or historical data) the population SDs of the 2 groups.
Decide what levels of alpha (e.g., 0.05) and beta (e.g., 0.2) are desired.
Submit these values (alpha, beta, the 2 estimated means, and the estimated pooled SDSDThe standard deviation (SD) is a measure of how far each observed value is from the mean in a data set.Measures of Central Tendency and Dispersion) into a reputable online SP calculator to obtain the sample size.
The calculations are somewhat complex and are always done using a computer.
An approximate sample size can be calculated by using the formula n =16s2/d2, as discussed above.
Examples of Statistical Power Calculations and Analysis
Scenario 1
A trial of a new fertilizer called “Grow-A-Lot” was given to a tomato farmer to determine if more tomatoes are produced per plant with the new fertilizer compared to plantsPlantsCell Types: Eukaryotic versus Prokaryotic not fertilized. The farmer picked 200 tomato seeds from a bucket of his usual planting seeds and divided them into 2 groups:
A group of 100 seeds that did not receive fertilizer (the control group)
A group of 100 seeds that received fertilizer (the experimental group)
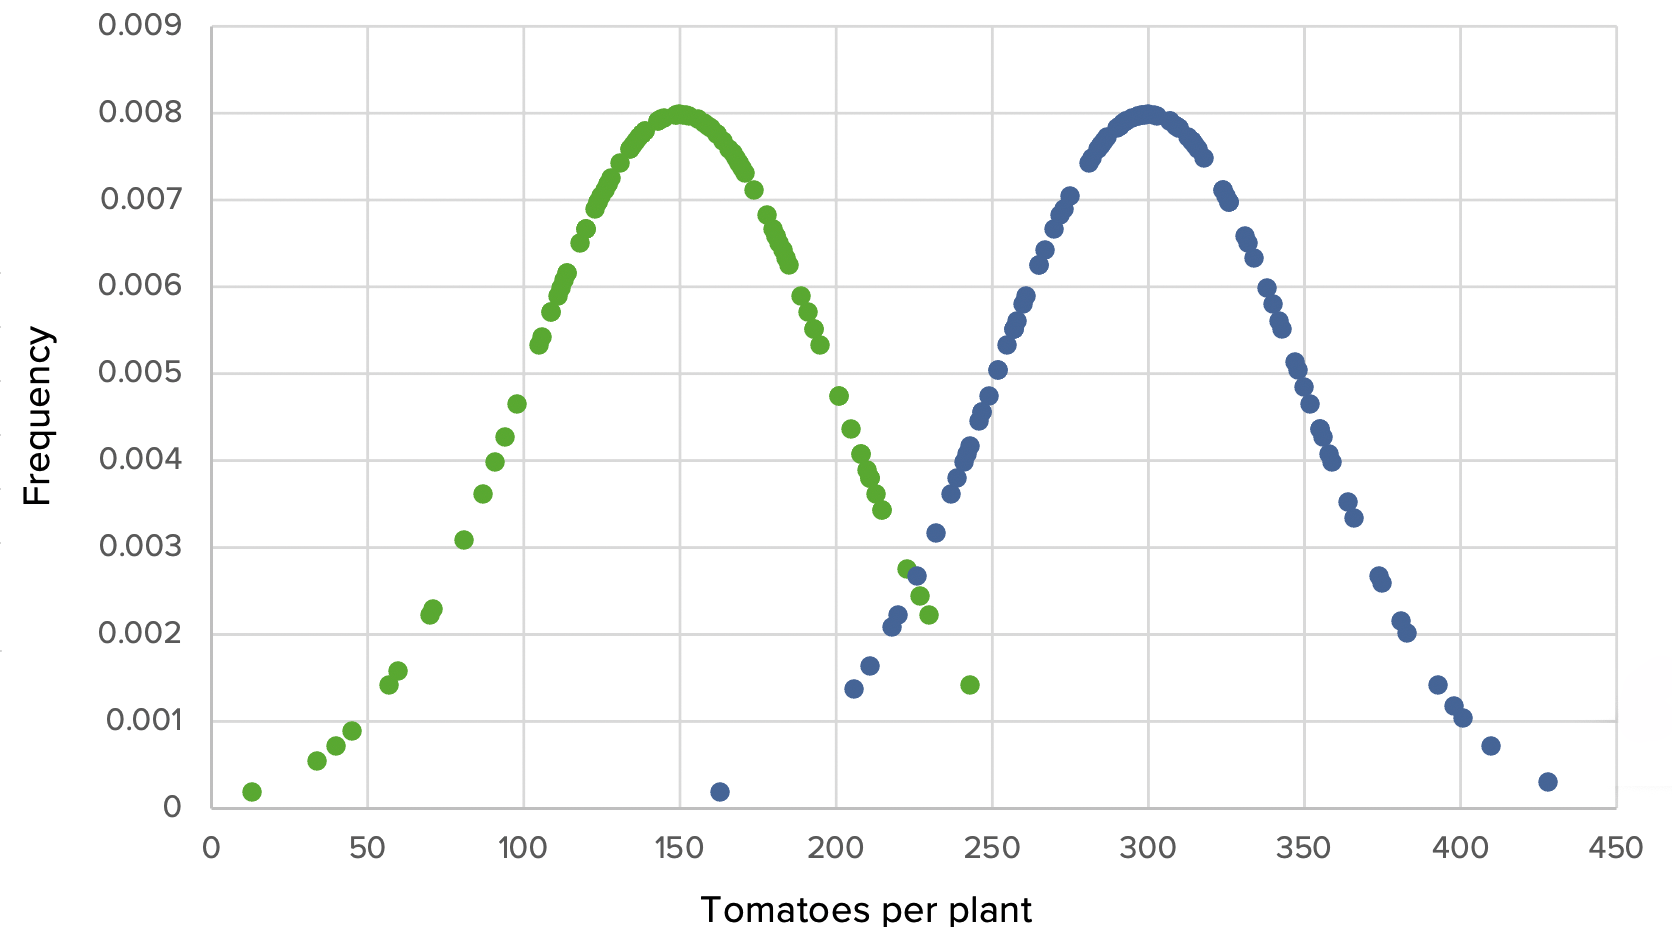
The fertilized group produced an average of twice the number of tomatoes (300) as the control group (150). There is also a small amount of overlap, since some plantsPlantsCell Types: Eukaryotic versus Prokaryotic in the control group overperformed the others in their group, whereas some plantsPlantsCell Types: Eukaryotic versus Prokaryotic in the experimental group underperformed. Just a glance at the graph is convincing enough to note that there is an obvious difference, but a t-test was performed to confirm that the difference was statistically significant, with a very small p-valueP-valueThe p-value is the probability of obtaining a given result, assuming the null hypothesis is true.Statistical Tests and Data Representation.
Trial 1, scenario 1: Graph demonstrating the use of Grow-A-Lot with large effect size, large SDs, means of 150 vs. 300, SD of 50 in each, and large sample sizes of 100
Green: control group Blue: experimental group
The 100 plants in the control group resulted in a mean of 150 tomatoes per plant. While the 100 plants which received fertilizer produced significantly more tomatoes with a mean of 300 tomatoes per plant. The result is significant at a p-value of < 0.05, so the null hypothesis is rejected.
Even if the experiment is repeated 1000 times, it would be extremely unlikely that the farmer would happen to pick a different set of seeds at random from the overlap region in order to yield a different result. The large size effect alone gives this trial a large amount of SP because it would be extremely unlikely that repeat sampling would produce a different result.
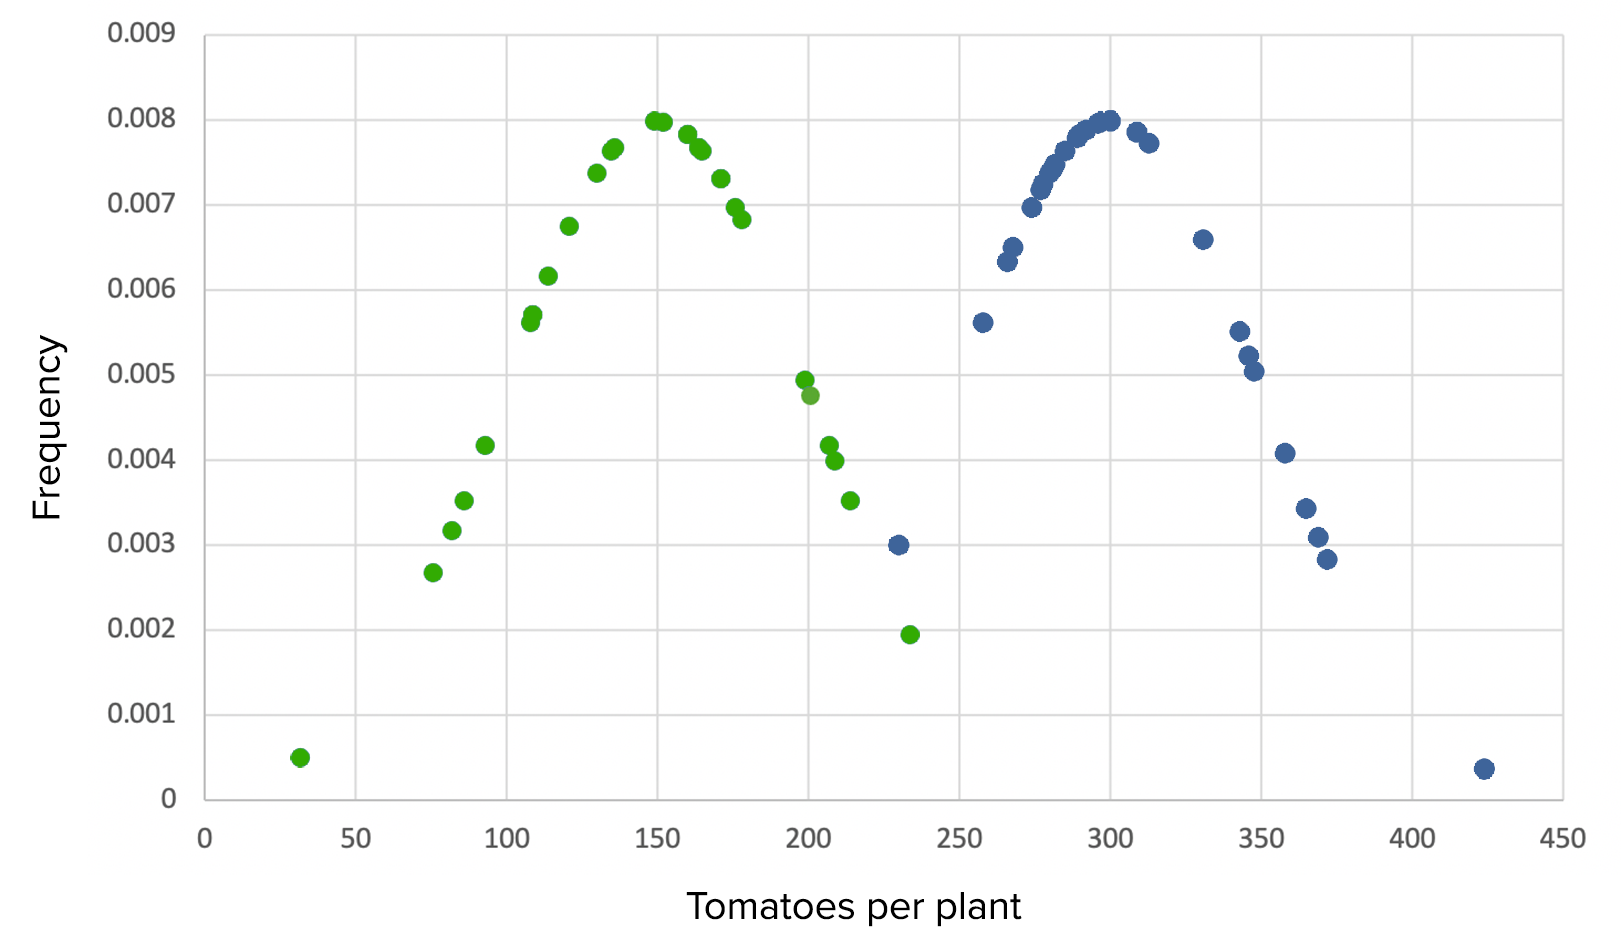
Trial 2 with small sample sizes:
The experiment would retain large SP with many fewer subject seeds as well, and almost all the t-tests would correctly give a significant (small) p-valueP-valueThe p-value is the probability of obtaining a given result, assuming the null hypothesis is true.Statistical Tests and Data Representation.
Trial 2, scenario 1: Graph demonstrating the use of Grow-A-Lot with large effect size, large SDs, means of 150 versus 300, SD of 50 in each, and small sample sizes of 30
Green: control group Blue: experimental group
A significant difference can still be seen between the groups both by eyeballing the graph and by statistical testing because of the large effect size. The result is significant at p < 0.05, so the null hypothesis is rejected.
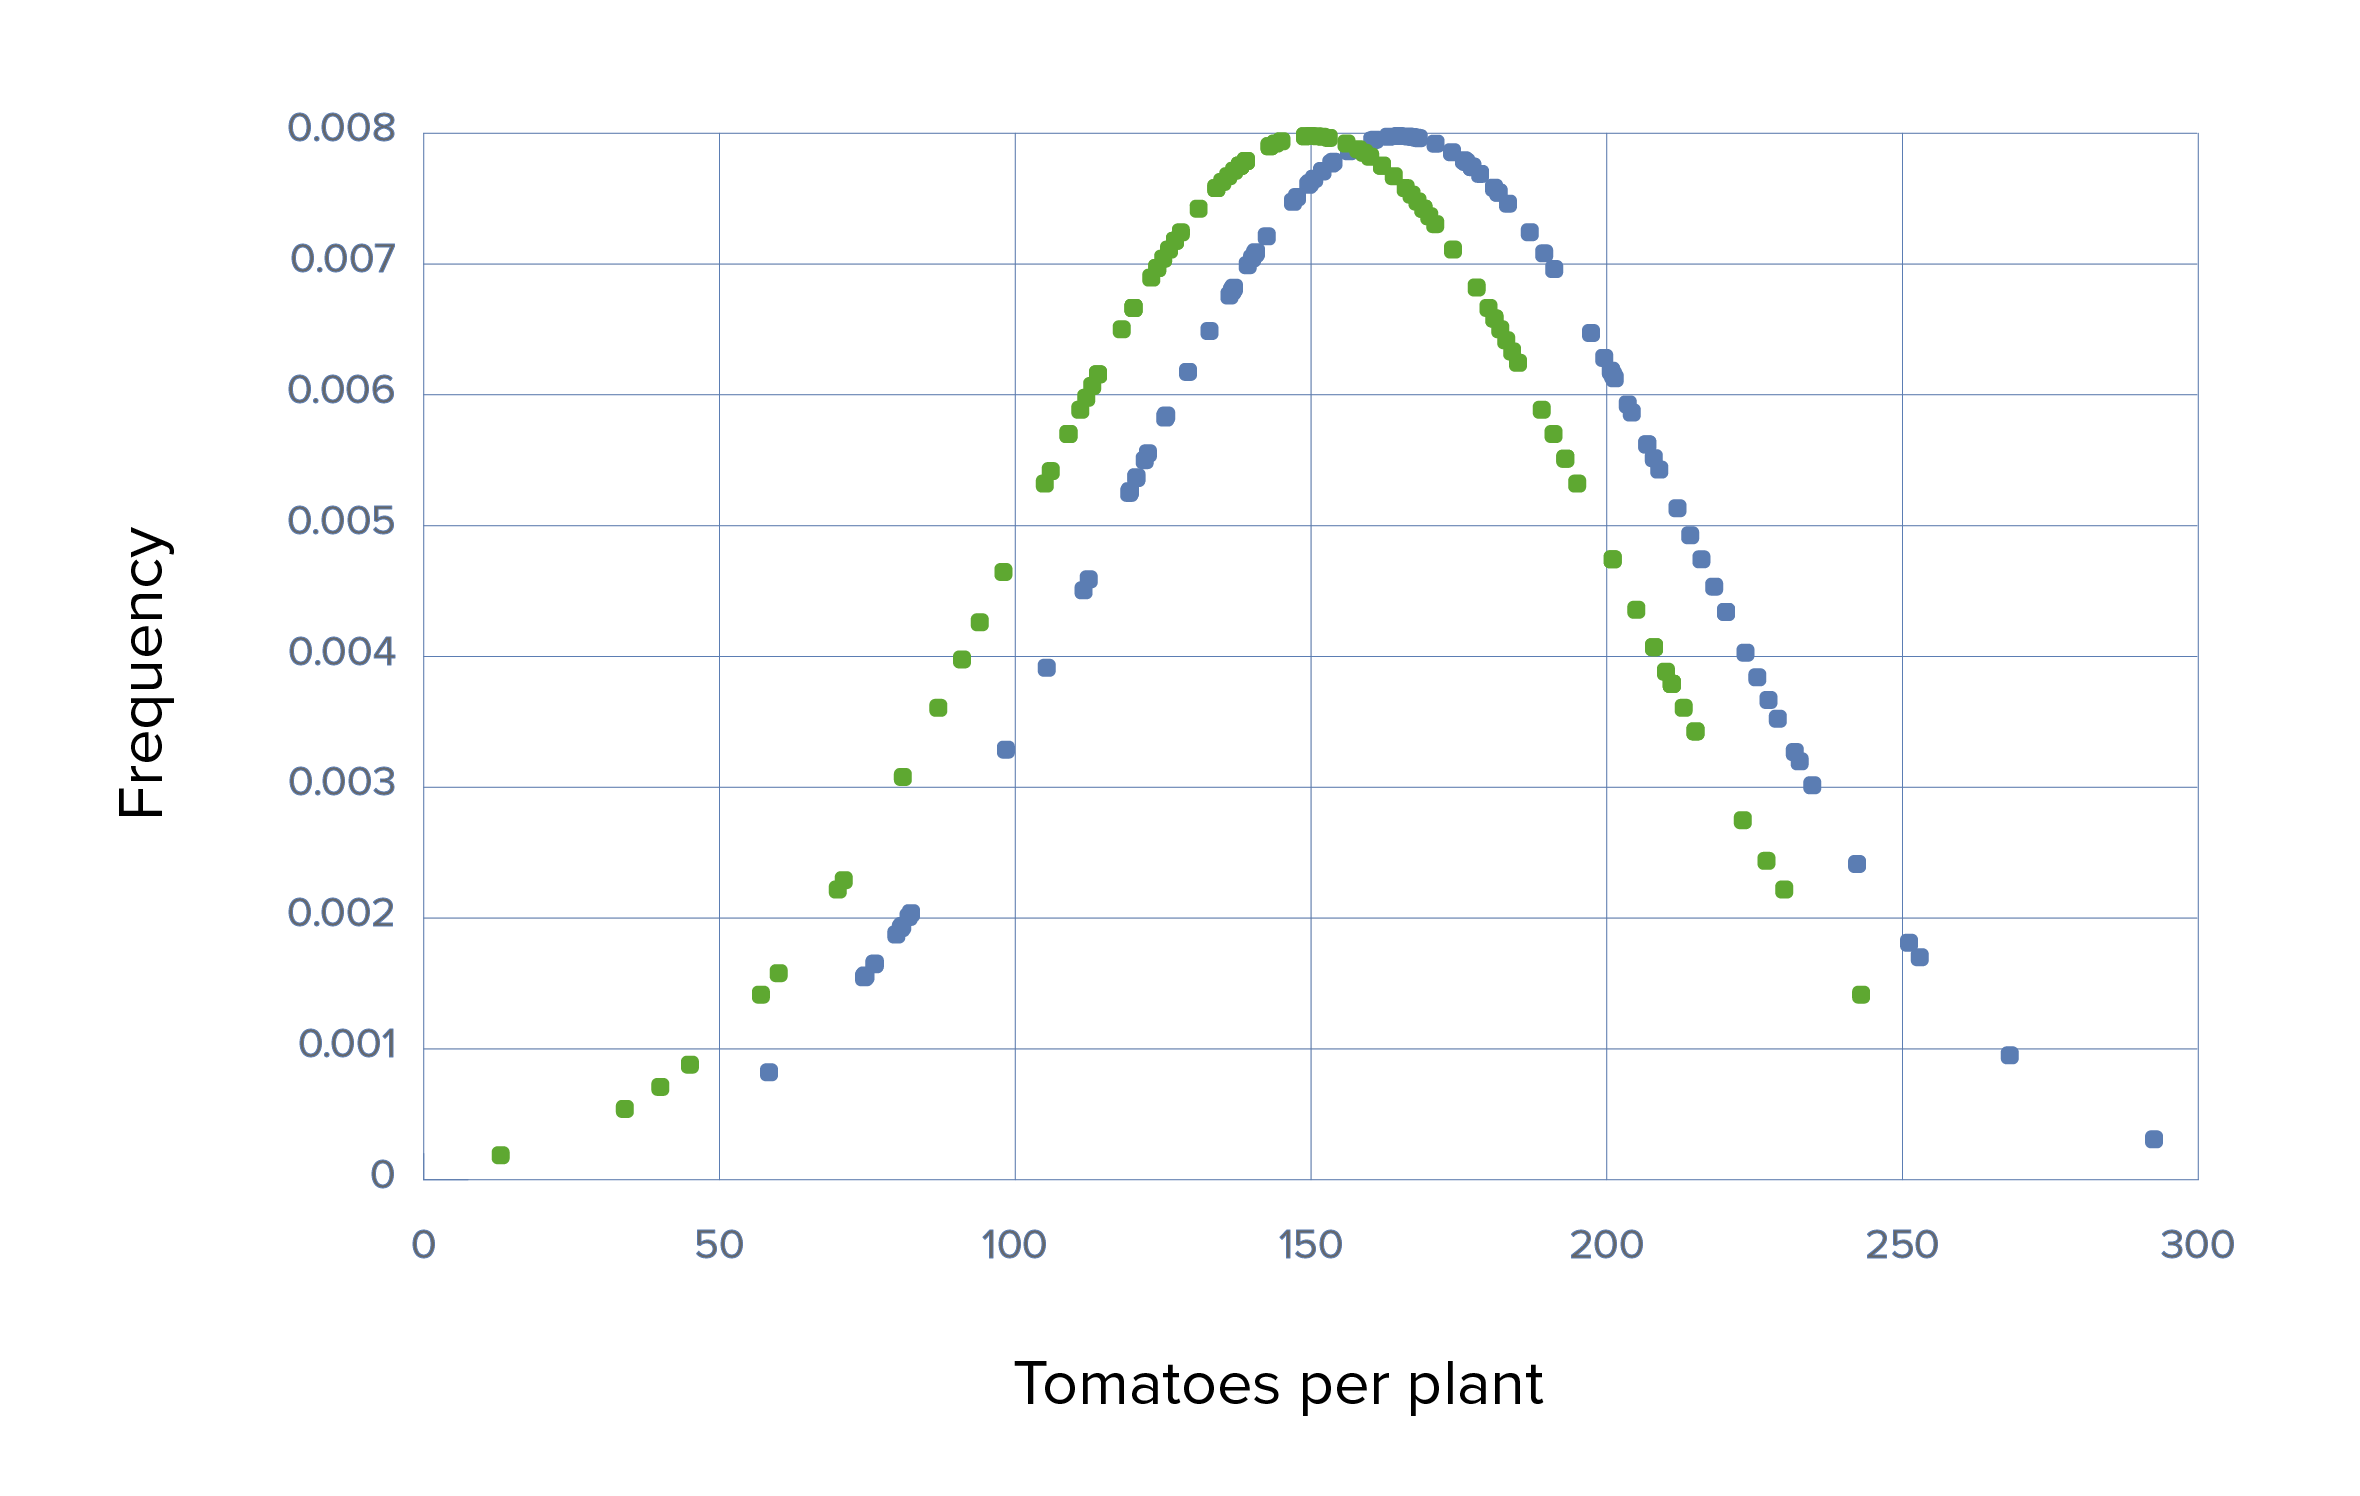
A different fertilizer is used (fertilizer “Grow-A-Little”) that has a much lesser effect, producing an average of only 10 extra tomatoes per plant. There will be a larger overlap of tomato production per plant between the experimental and the control groups, which can be detected only by using larger sample sizes.
Trial 3 with large sample sizes and large SDs:
The sample sizes are sufficiently large to counteract the small ES, making the difference statistically significant at a p-valueP-valueThe p-value is the probability of obtaining a given result, assuming the null hypothesis is true.Statistical Tests and Data Representation < 0.05. Note that, even though the difference is statistically significant, this small difference may not be of practical or relevant significance to the farmer.
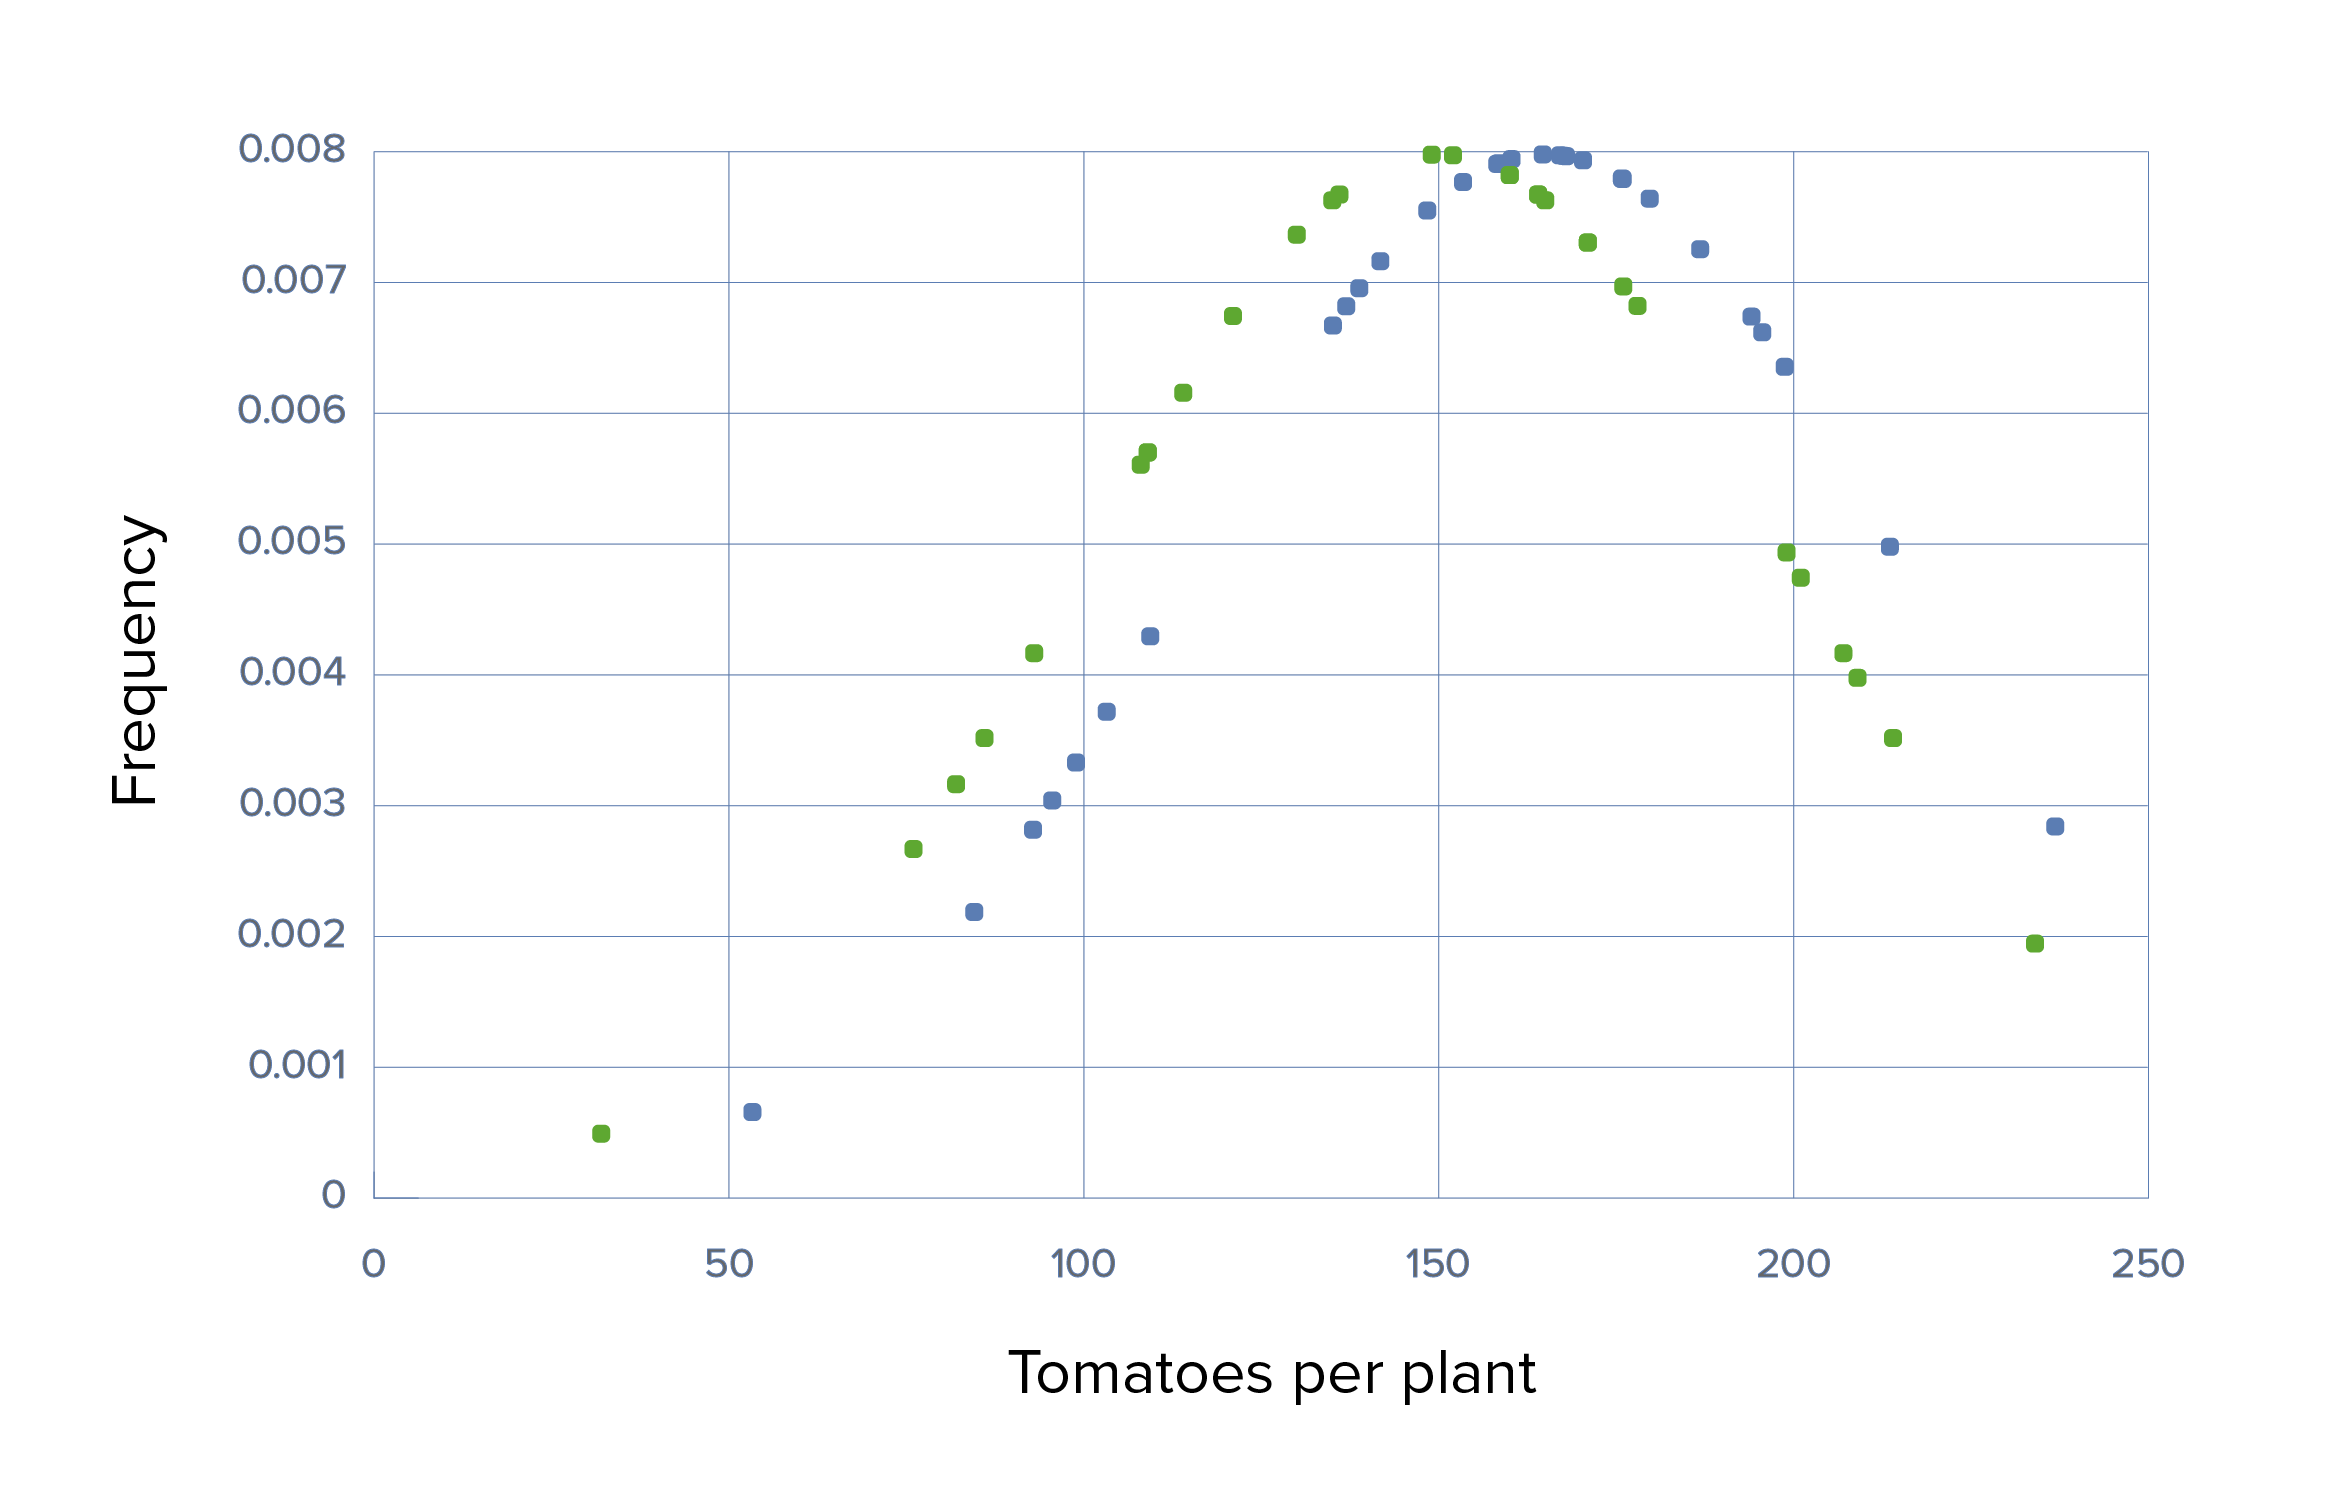
Trial 3, scenario 2: Graph demonstrating the use of Grow-A-Little with small effect size, large SDs, means of 150 versus 165, SD of 50 in each, and large sample sizes of 100
Green: control group Blue: experimental group.
The difference is statistically significant at a p-value of < 0.05 because the sample sizes were sufficiently large to counteract the small effect size. Note that, even though it is statistically significant, the small difference may not be of practical or relevant significance to the farmer.
Due to small sample sizes, no statistically significant difference is found at a p-valueP-valueThe p-value is the probability of obtaining a given result, assuming the null hypothesis is true.Statistical Tests and Data Representation < 0.05. So, the null hypothesisNull hypothesisThe null hypothesis (H0) states that there is no difference between the populations being studied (or put another way, there is no relationship between the variables being tested).Statistical Tests and Data Representation cannot be rejected because the trial did not have a large enough effect or sample size.
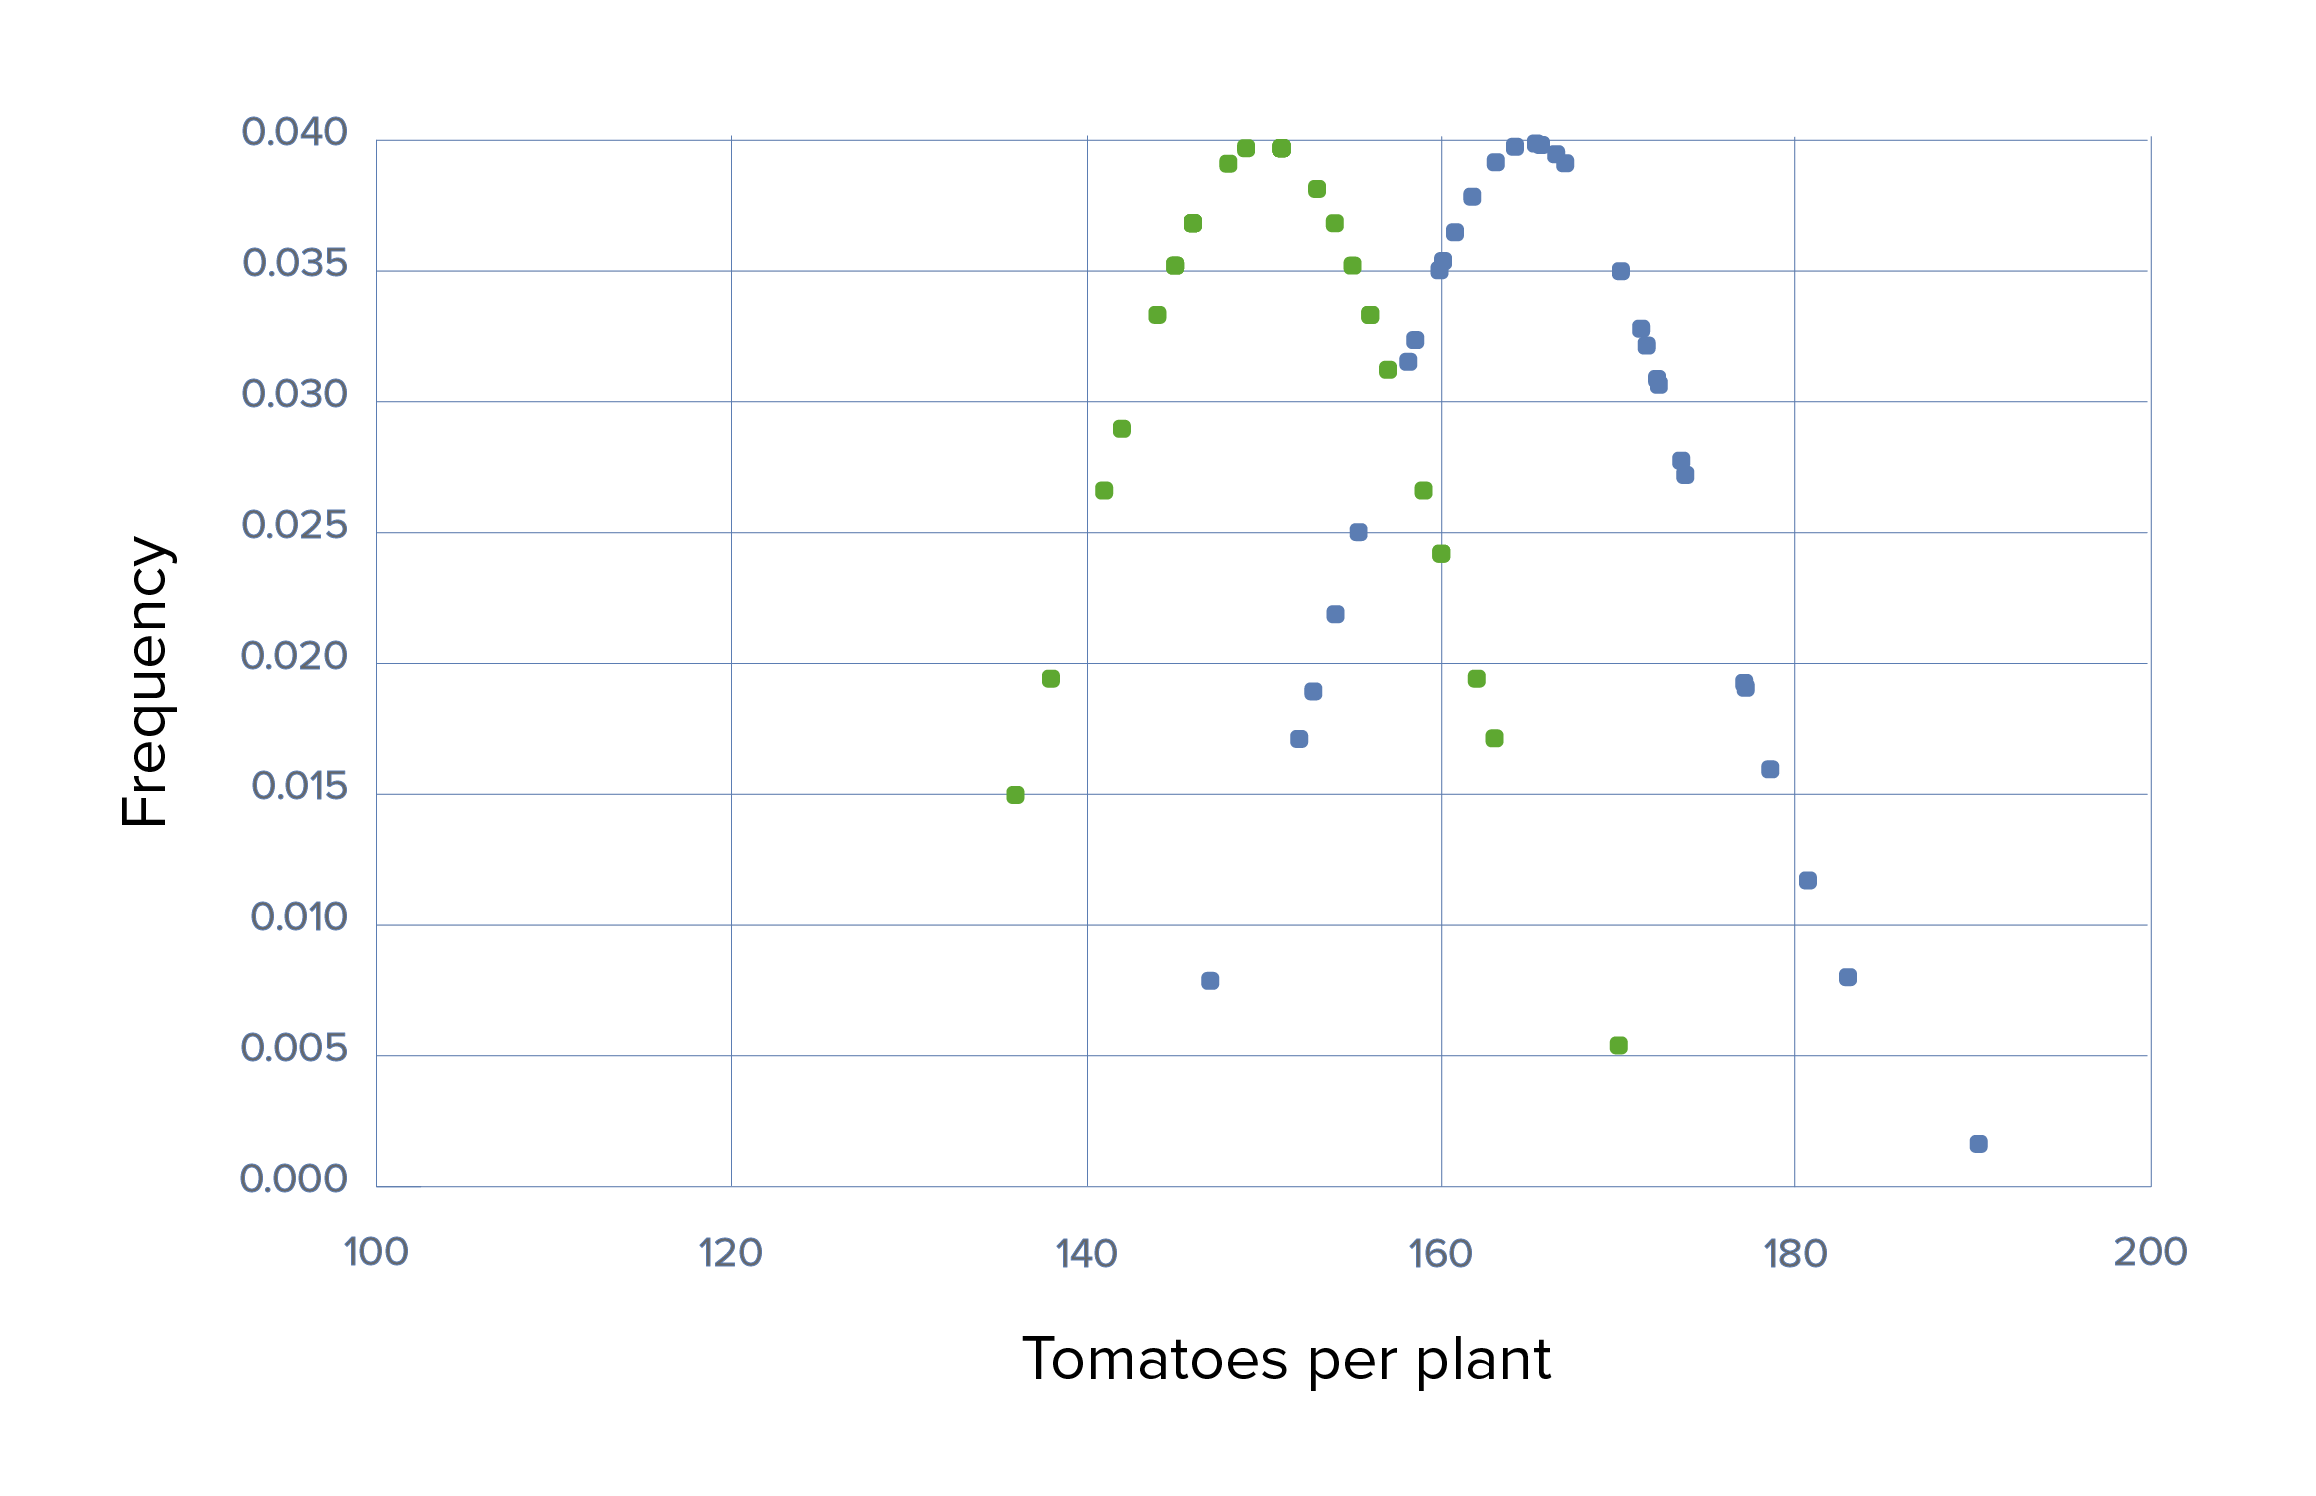
Trial 4, scenario 2: Graph demonstrating the use of Grow-A-Little with small effect size, large SDs, means of 150 versus 165, SD of 50 in each, and small sample sizes of 30
Green: control group Blue: experimental group
No statistically significant difference is revealed at a p-value of < 0.05, so the null hypothesis can not be rejected because the trial did not have a large enough effect size or large enough sample sizes.
Due to a small SDSDThe standard deviation (SD) is a measure of how far each observed value is from the mean in a data set.Measures of Central Tendency and Dispersion, the difference is statistically significant at a p-valueP-valueThe p-value is the probability of obtaining a given result, assuming the null hypothesis is true.Statistical Tests and Data Representation of 0.05. The SDSDThe standard deviation (SD) is a measure of how far each observed value is from the mean in a data set.Measures of Central Tendency and Dispersion is usually a fixed parameter in a population and cannot be changed, but the same result can be effectively obtained by increasing the sample size. The increase diminishes the impact of a large but fixed value of SDSDThe standard deviation (SD) is a measure of how far each observed value is from the mean in a data set.Measures of Central Tendency and Dispersion, allowing the detection of smaller differences between the groups tested.
Trial 5, scenario 2: Graph demonstrating the use of Grow-A-Little with small effect size, small SDs of 10 in each, means of 150 versus 165, and small sample sizes of 30
Green: control group Blue: experimental group
The difference is now statistically significant at a p-value of 0.05 because of the small SDs.
Investigators involved in designing a randomized clinical trial chose a sample size that would have 90% power of detecting a 20% difference between the control and experimental groups, with a significance level (2-sided) of 5%.
Question 1
If in actuality, there is no difference in the means, what is the chance that the study will find a statistically significant difference? What is this errorErrorRefers to any act of commission (doing something wrong) or omission (failing to do something right) that exposes patients to potentially hazardous situations.Disclosure of Information called?
Answer: This is just a terminology question and is typical of the type of question present on the board exams, with the power inserted as a distractor. Refer to the first multicolored graph above: if there is no difference between the 2 groups, then there would just be 1 bell curve, with the alpha cut-off describing the false positives; thus, the chance of finding a statistically significant difference is 5%, creating a type I (false positiveFalse positiveAn FP test result indicates that a person has the disease when they do not.Epidemiological Values of Diagnostic Tests) errorErrorRefers to any act of commission (doing something wrong) or omission (failing to do something right) that exposes patients to potentially hazardous situations.Disclosure of Information, because any subject having a value in the alpha area belongs to the same population.
Question 2
Does power increase/decrease/not change if beta is decreased?
Answer: Power increases if beta is decreased, as the power = 1 – beta. Refer to the first multicolored graph.
Question 3
Does power increase/decrease/not change if alpha is increased?
Answer: Power increases if alpha is increased, which increases the probabilityProbabilityProbability is a mathematical tool used to study randomness and provide predictions about the likelihood of something happening. There are several basic rules of probability that can be used to help determine the probability of multiple events happening together, separately, or sequentially.Basics of Probability of false positives; thus, increasing alpha is not a favored way of increasing power. Refer to the first multicolored graph to see the relationshipRelationshipA connection, association, or involvement between 2 or more parties.Clinician–Patient Relationship between alpha and power. In a board exam, a 2 x 2 contingency tableContingency tableA contingency table lists the frequency distributions of variables from a study and is a convenient way to look at any relationships between variables.Measures of Risk of reality/truth versus study/test results is often used to frame this question. It is important to understand how to calculate type I and type II errors.
Question 4
Does power increase/decrease/not change if the difference between the meanMeanMean is the sum of all measurements in a data set divided by the number of measurements in that data set.Measures of Central Tendency and Dispersion of the experimental group and that of the control group increases?
Answer: Power increases by increasing the meanMeanMean is the sum of all measurements in a data set divided by the number of measurements in that data set.Measures of Central Tendency and Dispersion difference, which is another way of increasing the ES as there is less overlap between the 2 distributions. See the first multicolored graph.
Question 5
Does beta increase/decrease/not change if the difference between the meanMeanMean is the sum of all measurements in a data set divided by the number of measurements in that data set.Measures of Central Tendency and Dispersion of the experimental group and that of the control group increases?
Answer: Beta decreases if the meanMeanMean is the sum of all measurements in a data set divided by the number of measurements in that data set.Measures of Central Tendency and Dispersion difference increases, as there is less overlap between the 2 populations. See the first multicolored graph.
Otte, W.M., Tijdink, J.K., Weerheim, P.L., Lamberink, H.J., Vinkers, C.H. (2018). Adequate statistical power in clinical trials is associated with the combination of a male first author and a female last author. eLife, 7:e34412. https://doi.org/10.7554/eLife.34412
Bland, M. (2015). An Introduction to Medical Statistics. 4th ed., pp. 295–304.
Ellis, P.D. (2010). The Essential Guide to Effect Sizes. Statistical Power, Meta-Analysis, and the Interpretation of Research Results. Pp. 46–86.
Walters, S.J., Campbell, M.J., Machin, D. (2020). Medical Statistics, A Textbook for the Health Sciences. 5th ed, pp. 40–48, 99–133.
Citrome, L., Ketter, T.A. (2013). When does a difference make a difference? Interpretation of number needed to treat, number needed to harm, and likelihood to be helped or harmed. International Journal of Clinical Practice, 67(5):407–411. https://doi.org/https://doi.org/10.1111/ijcp.12142
Ioannidis, J.P., Greenland, S., Hlatky, M.A., et al. (2014). Increasing value and reducing waste in research design, conduct, and analysis. Lancet, 383(9912):166–175.
Allen, J.C. (2011). Sample size calculation for two independent groups: A useful rule of thumb. Proceedings of Singapore Healthcare, 20(2):138–140. https://doi.org/10.1177/201010581102000213
Lehr, R. (1992). Sixteen S-squared over D-squared: A relation for crude sample size estimates. Statistics in Medicine, 11(8), 1099–1102. https://doi.org/10.1002/sim.4780110811
Create your free account or log in to continue reading!