Disease surveillanceSurveillanceDevelopmental Milestones and Normal Growth is an important and fundamental part of public health. Different epidemiologic measures are used to inform health care providers and policy-makers about the incidence rates, cumulative incidence, attack rates, prevalence, and person-time at risk of a disease or condition. SurveillanceSurveillanceDevelopmental Milestones and Normal Growth can help determine the cause of a disease as well as monitor the risks for developing that disease. SurveillanceSurveillanceDevelopmental Milestones and Normal Growth also follows changes in the levels of risk, thereby providing guidance for developing and implementing programs for disease prevention and control.
Incidence refers to the number of new cases of a certain disease or event in a population over a specified period of time. There are 2 ways of measuring incidence: cumulative incidence (CICIThe percentage of the chest diameter occupied by the heart.Imaging of the Heart and Great Vessels) and incidence rate (IR). Both are measures of the risk of contracting a disease or condition.
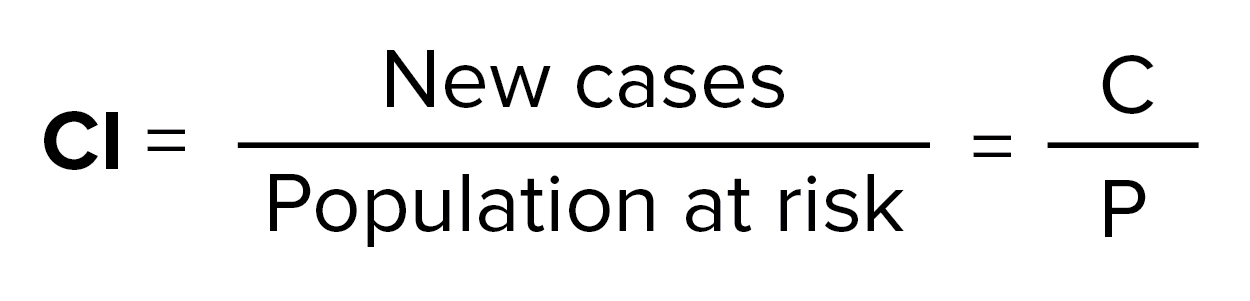
Cumulative incidence per 1,000 = (Number of new cases of disease occurring in a population over a specified period of time) / (Number of total individuals in the population who are at risk for developing the disease during the specifiedperiod of time) x 1,000:
CI is also known as cumulative incidence proportion, incidence proportion, risk, attack rate, or probability of developing the disease.
CI is not a true rate but a proportion, as the people included in the numerator are also included in the denominator (total population)
The denominator should include only “at-risk“ individuals. Individuals who already have the disease or are incapable of contracting the disease must be excluded from the population.
The number used to multiply depends on the frequency of the disease. For example, 1,000 may be sufficient to use for a common disease, but 100,000 or 1,000,000 would be required for a rare disease. Using 100 as the multiplier makes the CICIThe percentage of the chest diameter occupied by the heart.Imaging of the Heart and Great Vessels proportion a percentage.
People who die from another cause (a “competing risk”) during the observation period
When people developed the disease (i.e., at the beginning, middle, or late in the observation period)
The synonym attack rate is commonly used during outbreaksOutbreaksSudden increase in the incidence of a disease. The concept includes epidemics and pandemics.Influenza Viruses/Influenza of disease and in hypothetical predictions.
Food-specific attack rate per 100 = (Number of susceptible or at-risk individuals who were exposed to a pathogen or suspect food who became ill) / (Number of total individuals who were exposed to that pathogen or food)
Example: If 30 people developed gastroenteritisGastroenteritisGastroenteritis is inflammation of the stomach and intestines, commonly caused by infections from bacteria, viruses, or parasites. Transmission may be foodborne, fecal-oral, or through animal contact. Common clinical features include abdominal pain, diarrhea, vomiting, fever, and dehydration.Gastroenteritis after eating potato salad, and 100 people in total ate the salad, then the ARARAortic regurgitation (AR) is a cardiac condition characterized by the backflow of blood from the aorta to the left ventricle during diastole. Aortic regurgitation is associated with an abnormal aortic valve and/or aortic root stemming from multiple causes, commonly rheumatic heart disease as well as congenital and degenerative valvular disorders. Aortic Regurgitation = 30 / 100 x 100 = 30%, which is the risk of becoming ill after eating the salad.
CICIThe percentage of the chest diameter occupied by the heart.Imaging of the Heart and Great Vessels is used mostly used in situations where the follow-up time is relatively short and there is relatively little loss to follow-up. Otherwise, epidemiologists generally use the incidence rate.
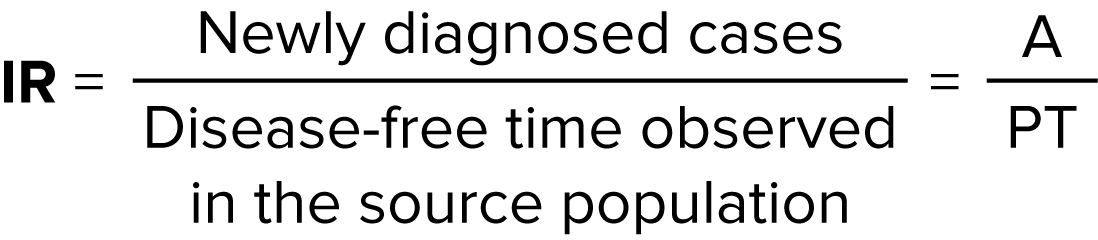
Incidence rate per 1,000 = (Number of new casesof disease occurring in the population during a specified period of time) / (Total person-time, or the sum of the time periods of observation of each person who was observed) x 1,000
IR is a true rate and is also known as person-time rate or incidence density.
Total person-time: based on the eligibility criteria for the study population that an individual must be at risk (disease-free) and actively followed. Once a person develops the disease or is lost to follow-up, their contribution of time at risk ends. If their contribution ends after 1 year, then that person has contributed 1 person-year (py) to the study. For example:
1 individual at risk who is in a 1-year study = 1 py
5 individuals at risk who are in a 5-year study = 25 py
5 individuals at risk who are in a 5-year study, with 2 being lost to follow-up or disease after 1 year while the remaining 3 continue to be at risk for the full 5 years = 2 py + (3 x 5) = 17 py
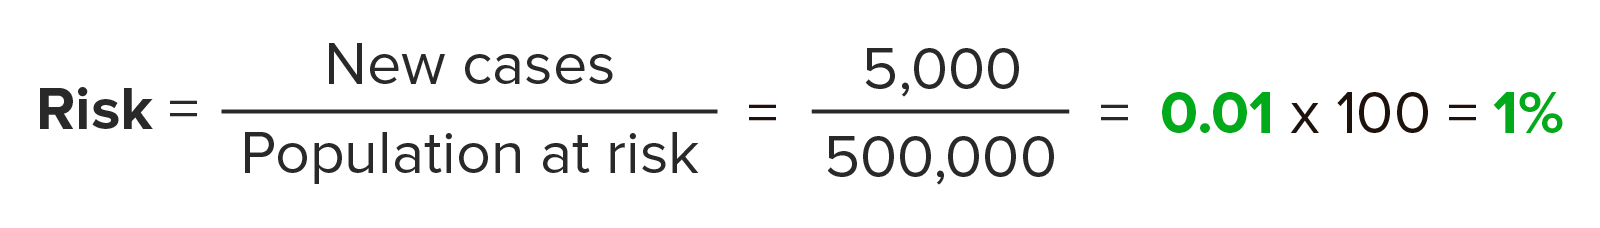
Over the past year at a particular hospital, 500,000 patientsPatientsIndividuals participating in the health care system for the purpose of receiving therapeutic, diagnostic, or preventive procedures.Clinician–Patient Relationship were admitted for hip or knee replacements. Five thousand of those patientsPatientsIndividuals participating in the health care system for the purpose of receiving therapeutic, diagnostic, or preventive procedures.Clinician–Patient Relationship over that year had a venous thromboembolismThromboembolismObstruction of a blood vessel (embolism) by a blood clot (thrombus) in the blood stream.Systemic Lupus Erythematosus (VTEVTEObstruction of a vein or veins (embolism) by a blood clot (thrombus) in the bloodstream.Hypercoagulable States) during their admission. What is the risk of developing VTEVTEObstruction of a vein or veins (embolism) by a blood clot (thrombus) in the bloodstream.Hypercoagulable States over the past year at this hospital?
There are 5,000 new cases of VTEVTEObstruction of a vein or veins (embolism) by a blood clot (thrombus) in the bloodstream.Hypercoagulable States over the year in a population at risk of 500,000.
Therefore, 1% of those admitted, or 1 out of 100 patientsPatientsIndividuals participating in the health care system for the purpose of receiving therapeutic, diagnostic, or preventive procedures.Clinician–Patient Relationship, experienced VTEVTEObstruction of a vein or veins (embolism) by a blood clot (thrombus) in the bloodstream.Hypercoagulable States during their hospitalizationHospitalizationThe confinement of a patient in a hospital.Delirium.
Incidence rate
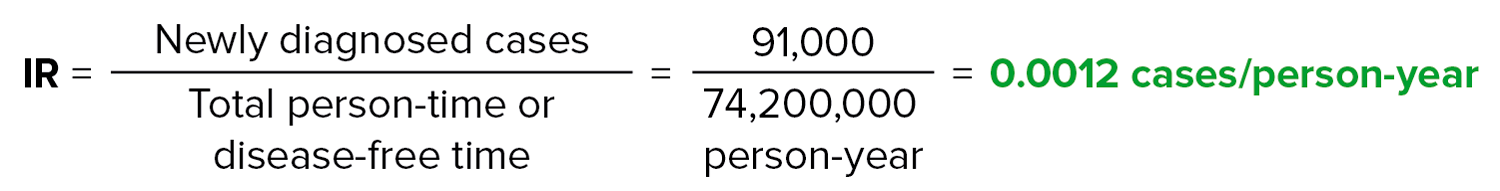
Over the time period from 2000 to 2009, in Quebec, Canada, there were 91,000 cases of VTEVTEObstruction of a vein or veins (embolism) by a blood clot (thrombus) in the bloodstream.Hypercoagulable States over a population, with a disease-free time over that period that totals 74,200,000 py. What is the IR of VTEVTEObstruction of a vein or veins (embolism) by a blood clot (thrombus) in the bloodstream.Hypercoagulable States in Quebec over this time period?
Therefore, the IR is 0.0012 cases per py. By convention, this is multiplied by 10,000 to get 12 cases per 10,000 py of observation.
Prevalence
Definition
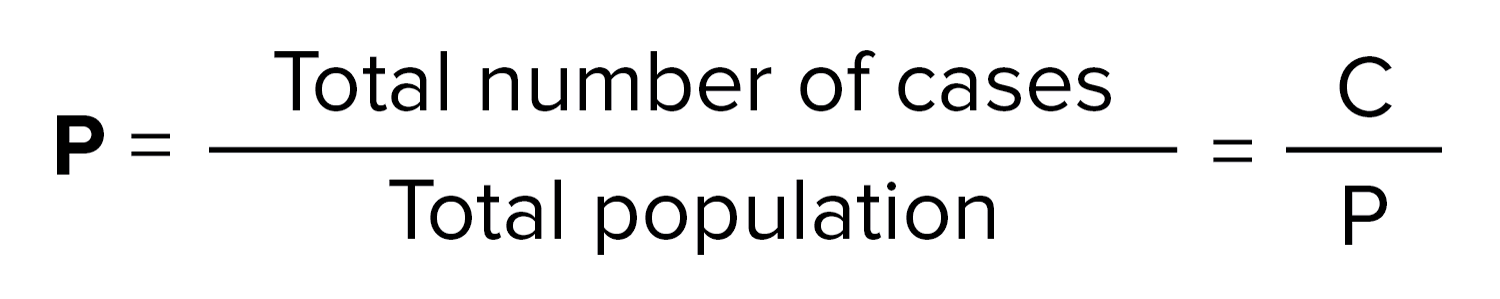
Prevalence is the number of affected individuals present in a population at a particular point in time divided by the number of total individuals in the population at that point in time (point prevalence) or over a period of time (period prevalence). Prevalence is typically expressed as a proportion or percentage.
Point prevalence is like a “snapshot”of the population that determines who has the disease and who does not; much more commonly used than period prevalence.
Does not measure risk, but provides an important measure of the burden of disease in a community, which is necessary for resource allocation.
Prevalence cannot provide a risk estimation, as it does not give information about when the disease developed. Some individuals may have developed the disease a week ago, some last year, and some 20 years ago.
There is a relationship between prevalence and incidence (Prevalence = Incidence × Duration of disease) as long as:
In 2 hypothetical cities, with 1,000 inhabitants in each, there is a contagious disease with a prevalence of 100 / 1,000 in City A and a prevalence of 60 / 1,000 in City B.
There is not enough information to determine which city would be “less risky” to live in without considering incidence.
However, if City B has an incidence of 20 cases / year, while City A has only 4 cases / year, then City B is riskier.
The prevalence in City B is lower because the average survival of a diseased person in City B is only 3 years, while a diseased person in City A lives an average of 25 years.
For City A: 4 / year x 25 years = 100 / 1,000
For City B: 20 / year x 3 years = 60 / 1,000
Period prevalence
Over the past year, there were 12 million patientsPatientsIndividuals participating in the health care system for the purpose of receiving therapeutic, diagnostic, or preventive procedures.Clinician–Patient Relationship in the Medicare database, and 200,000 Medicare patientsPatientsIndividuals participating in the health care system for the purpose of receiving therapeutic, diagnostic, or preventive procedures.Clinician–Patient Relationship suffered a VTEVTEObstruction of a vein or veins (embolism) by a blood clot (thrombus) in the bloodstream.Hypercoagulable States. What is the period prevalence of VTEVTEObstruction of a vein or veins (embolism) by a blood clot (thrombus) in the bloodstream.Hypercoagulable States in Medicare patientsPatientsIndividuals participating in the health care system for the purpose of receiving therapeutic, diagnostic, or preventive procedures.Clinician–Patient Relationship in the United States over the past year?
The period prevalence for the year is a measure of the proportion of Medicare patientsPatientsIndividuals participating in the health care system for the purpose of receiving therapeutic, diagnostic, or preventive procedures.Clinician–Patient Relationship who had VTEVTEObstruction of a vein or veins (embolism) by a blood clot (thrombus) in the bloodstream.Hypercoagulable States. There were 12 million patientsPatientsIndividuals participating in the health care system for the purpose of receiving therapeutic, diagnostic, or preventive procedures.Clinician–Patient Relationship in the Medicare database; 200,000 of these patientsPatientsIndividuals participating in the health care system for the purpose of receiving therapeutic, diagnostic, or preventive procedures.Clinician–Patient Relationship had VTEVTEObstruction of a vein or veins (embolism) by a blood clot (thrombus) in the bloodstream.Hypercoagulable States.
Therefore, the period prevalence of VTEVTEObstruction of a vein or veins (embolism) by a blood clot (thrombus) in the bloodstream.Hypercoagulable States in Medicare patientsPatientsIndividuals participating in the health care system for the purpose of receiving therapeutic, diagnostic, or preventive procedures.Clinician–Patient Relationship for the year was 1.6%.
References
Greenberg, R. S. (2014). Epidemiologic measures. R. S. Greenberg (Ed.), Medical Epidemiology: Population health and effective health care, 5e (). New York, NY: McGraw-Hill Education. accessmedicine.mhmedical.com/content.aspx?aid=1108589766
Thacker, S. B. et al. (2006). Measuring the public’s health. Public health reports (Washington, D.C.: 1974), 121(1), 14–22. DOI:10.1177/003335490612100107
Celentano, David D., ScD., M.H.S., & Szklo, Moyses, MD, M.P.H., DrP.H. (2019). The occurrence of disease: I. disease surveillance and measures of morbidity. Celentano, David D., ScD, MHS, & Szklo, Moyses, MD, MPH,DrPH (Eds.), Gordis epidemiology(pp. 41-64)https://www.clinicalkey.es/#!/content/3-s2.0-B9780323552295000036
Celentano, David D., ScD., M.H.S., & Szklo, Moyses, MD, M.P.H., DrP.H. (2019). The occurrence of disease: II. mortality and other measures of disease impact. Celentano, David D., ScD, MHS, & Szklo, Moyses, MD, MPH,DrPH (Eds.), Gordis epidemiology (pp. 65-93) from https://www.clinicalkey.es/#!/content/3-s2.0-B9780323552295000048