The electrocardiogram (ECG) provides insights into a patient’s heart rhythm, rate, and electrical activity. ECGs are non-invasive, diagnostic tools essential for identifying arrhythmias, evidence of ischemia, and effects of cardiac medications. Nurses must understand the significance of the P wave, QRS complex, and T wave, including the duration of each and intervals. Accurate interpretation aids in the rapid diagnosis and treatment of heart conditions.
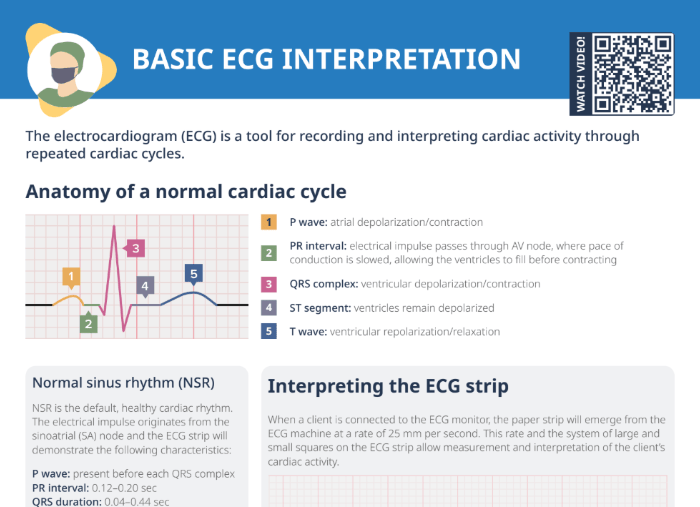
The electrocardiogram (ECG) is a medical test for recording and interpreting cardiac activity through repeated cardiac cycles. The ECG is commonly used in many healthcare settings, including routine physical exams, emergency care, and cardiac monitoring during surgery.
It’s a non-invasive procedure, where small electrode patches are attached to the skin of the chest, arms, and legs. These electrodes detect the electrical impulses generated by the heart as it beats, which are then transmitted to an ECG machine. This machine translates the electrical activity into line tracings on paper or screens, which provide information about the heart’s rhythm and rate and help diagnose heart conditions.
What is a normal ECG reading?
A normal ECG (electrocardiogram) reading features a consistent heart rhythm and characteristic wave patterns corresponding to each phase of the heartbeat. The normal sinus rhythm (NSR) is the default, healthy cardiac rhythm. The electrical impulse originates from the sinoatrial (SA) node and the ECG strip will demonstrate the following characteristics:
Normal resting heart rate from 60 to 100 bpm
Regular rhythm with consistent intervals between each heartbeat
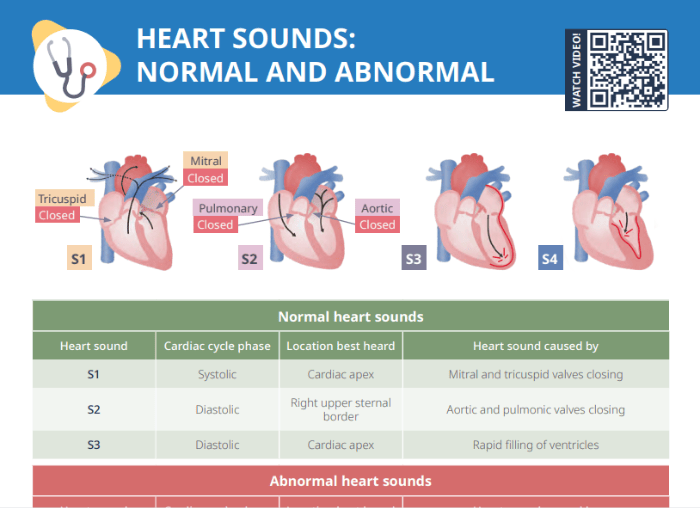
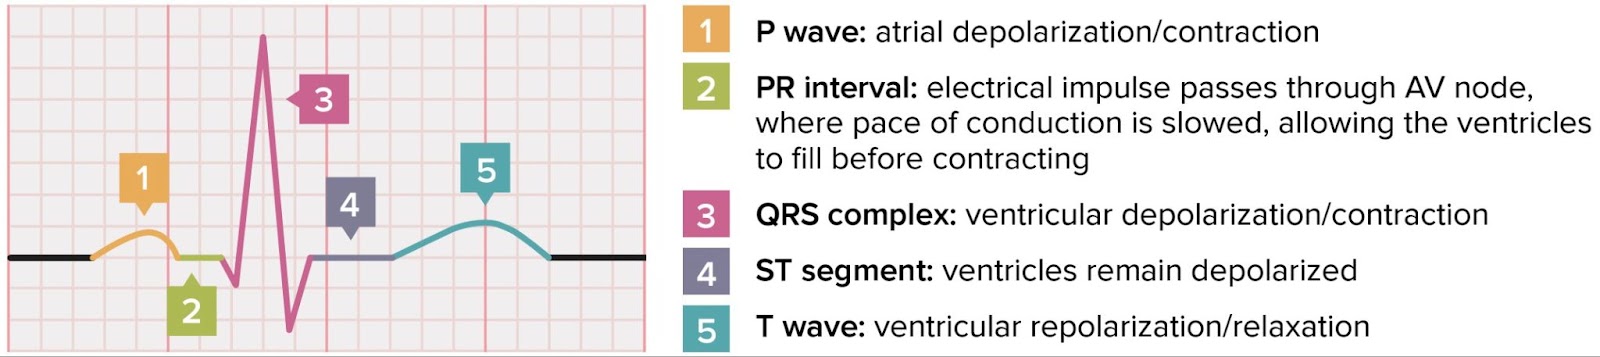
P wave should be upright in most leads, consistent in size and shape, and present before each QRS complex.
Normal PR interval: 0.12 to 0.20 seconds
QRS complex should last 0.04–0.44 seconds
ST segment follows the QRS complex and should be on the baseline.
QT interval varies based on heart rate but is generally up to 0.44 seconds.
T wave should be positive (upright) in most leads and less than 5 mm in height.
What is an abnormal ECG reading?
An abnormal ECG reading indicates that the heart’s electrical activity may deviate from the typical, regular patterns. Common abnormalities include arrhythmias (e.g., atrial fibrillation), hypertrophy of the heart, electrolyte imbalances, conduction abnormalities (e.g., right bundle branch block), pericarditis, or pulmonary embolism. Pathologic Q waves or ST segment elevations can indicate myocardial infarction.
Common variations from NSR
Sinus bradycardia: All features of a normal cardiac rhythm are present, but rate is slower than 60 bpm.
Sinus tachycardia: All features of a normal cardiac rhythm are present, but rate is greater than 100 bpm. T wave may be “buried,” or absent, at increased HR.
When a client is connected to the ECG monitor, the paper strip will emerge from the ECG machine at a rate of 25 mm per second. This rate and the system of large and small squares on the ECG strip allow measurement and interpretation of the client’s cardiac activity.
Note: One small square on the ECG strip equals 40 milliseconds; one large square is 200 milliseconds.
Here’s how to interpret the ECG strip to get the most important information points about your client’s cardiac activity:
General: Check for any abnormal patterns suggesting conditions like atrial fibrillation, atrial flutter, ventricular tachycardia, or ST-elevation myocardial infarction (STEMI).
QRS complex: Check the width (duration), which should be 0.04–0.44 seconds. Evaluate if the QRS follows each P wave, as this indicates normal atrioventricular conduction.
P wave: Identify the P wave shape and size. They should be upright and consistent. Each P wave should be followed by a QRS complex.
T wave: Usually goes in the same direction as the QRS and should be less than 5 mm in height. Observe its symmetry; it should be slightly asymmetric.
PR interval: Measure the time from the start of the P wave to the start of the QRS complex. Normal PR interval is 0.12–0.20 seconds (3–5 small boxes on the ECG paper).
ST segment: Analyze the line from the end of the QRS to the start of the T wave. It should be flat, neither elevated more than 1 small box above baseline nor depressed more than 0.5 boxes.
QT interval: Measure from the start of the QRS complex to the end of the T wave, representing total ventricular activity. The normal QT interval varies based on heart rate but is usually 0.36–0.44 seconds.
Heart rate: Count the number of QRS complexes in a 6-second strip and multiply by 10 to get the beats per minute (BPM).
Rhythm: Analyze the regularity of the beats by looking at the R-R interval (the distance between successive R waves). Are they evenly spaced?
Download the free cheat sheet for a study summary and an example reading!
Overview of the anatomy of the normal cardiac cycle, characteristics of the normal sinus rhythm, cardiac strip interpretation, and common variations from NSR.
Master the topic with a unique study combination of a concise summary paired with video lectures.