Playlist
Show Playlist
Hide Playlist
Regulation of ADH: ADH Secretion

-
Slides RegulationADHandSIADH RenalPathology.pdf
-
Reference List Pathology.pdf
-
Download Lecture Overview
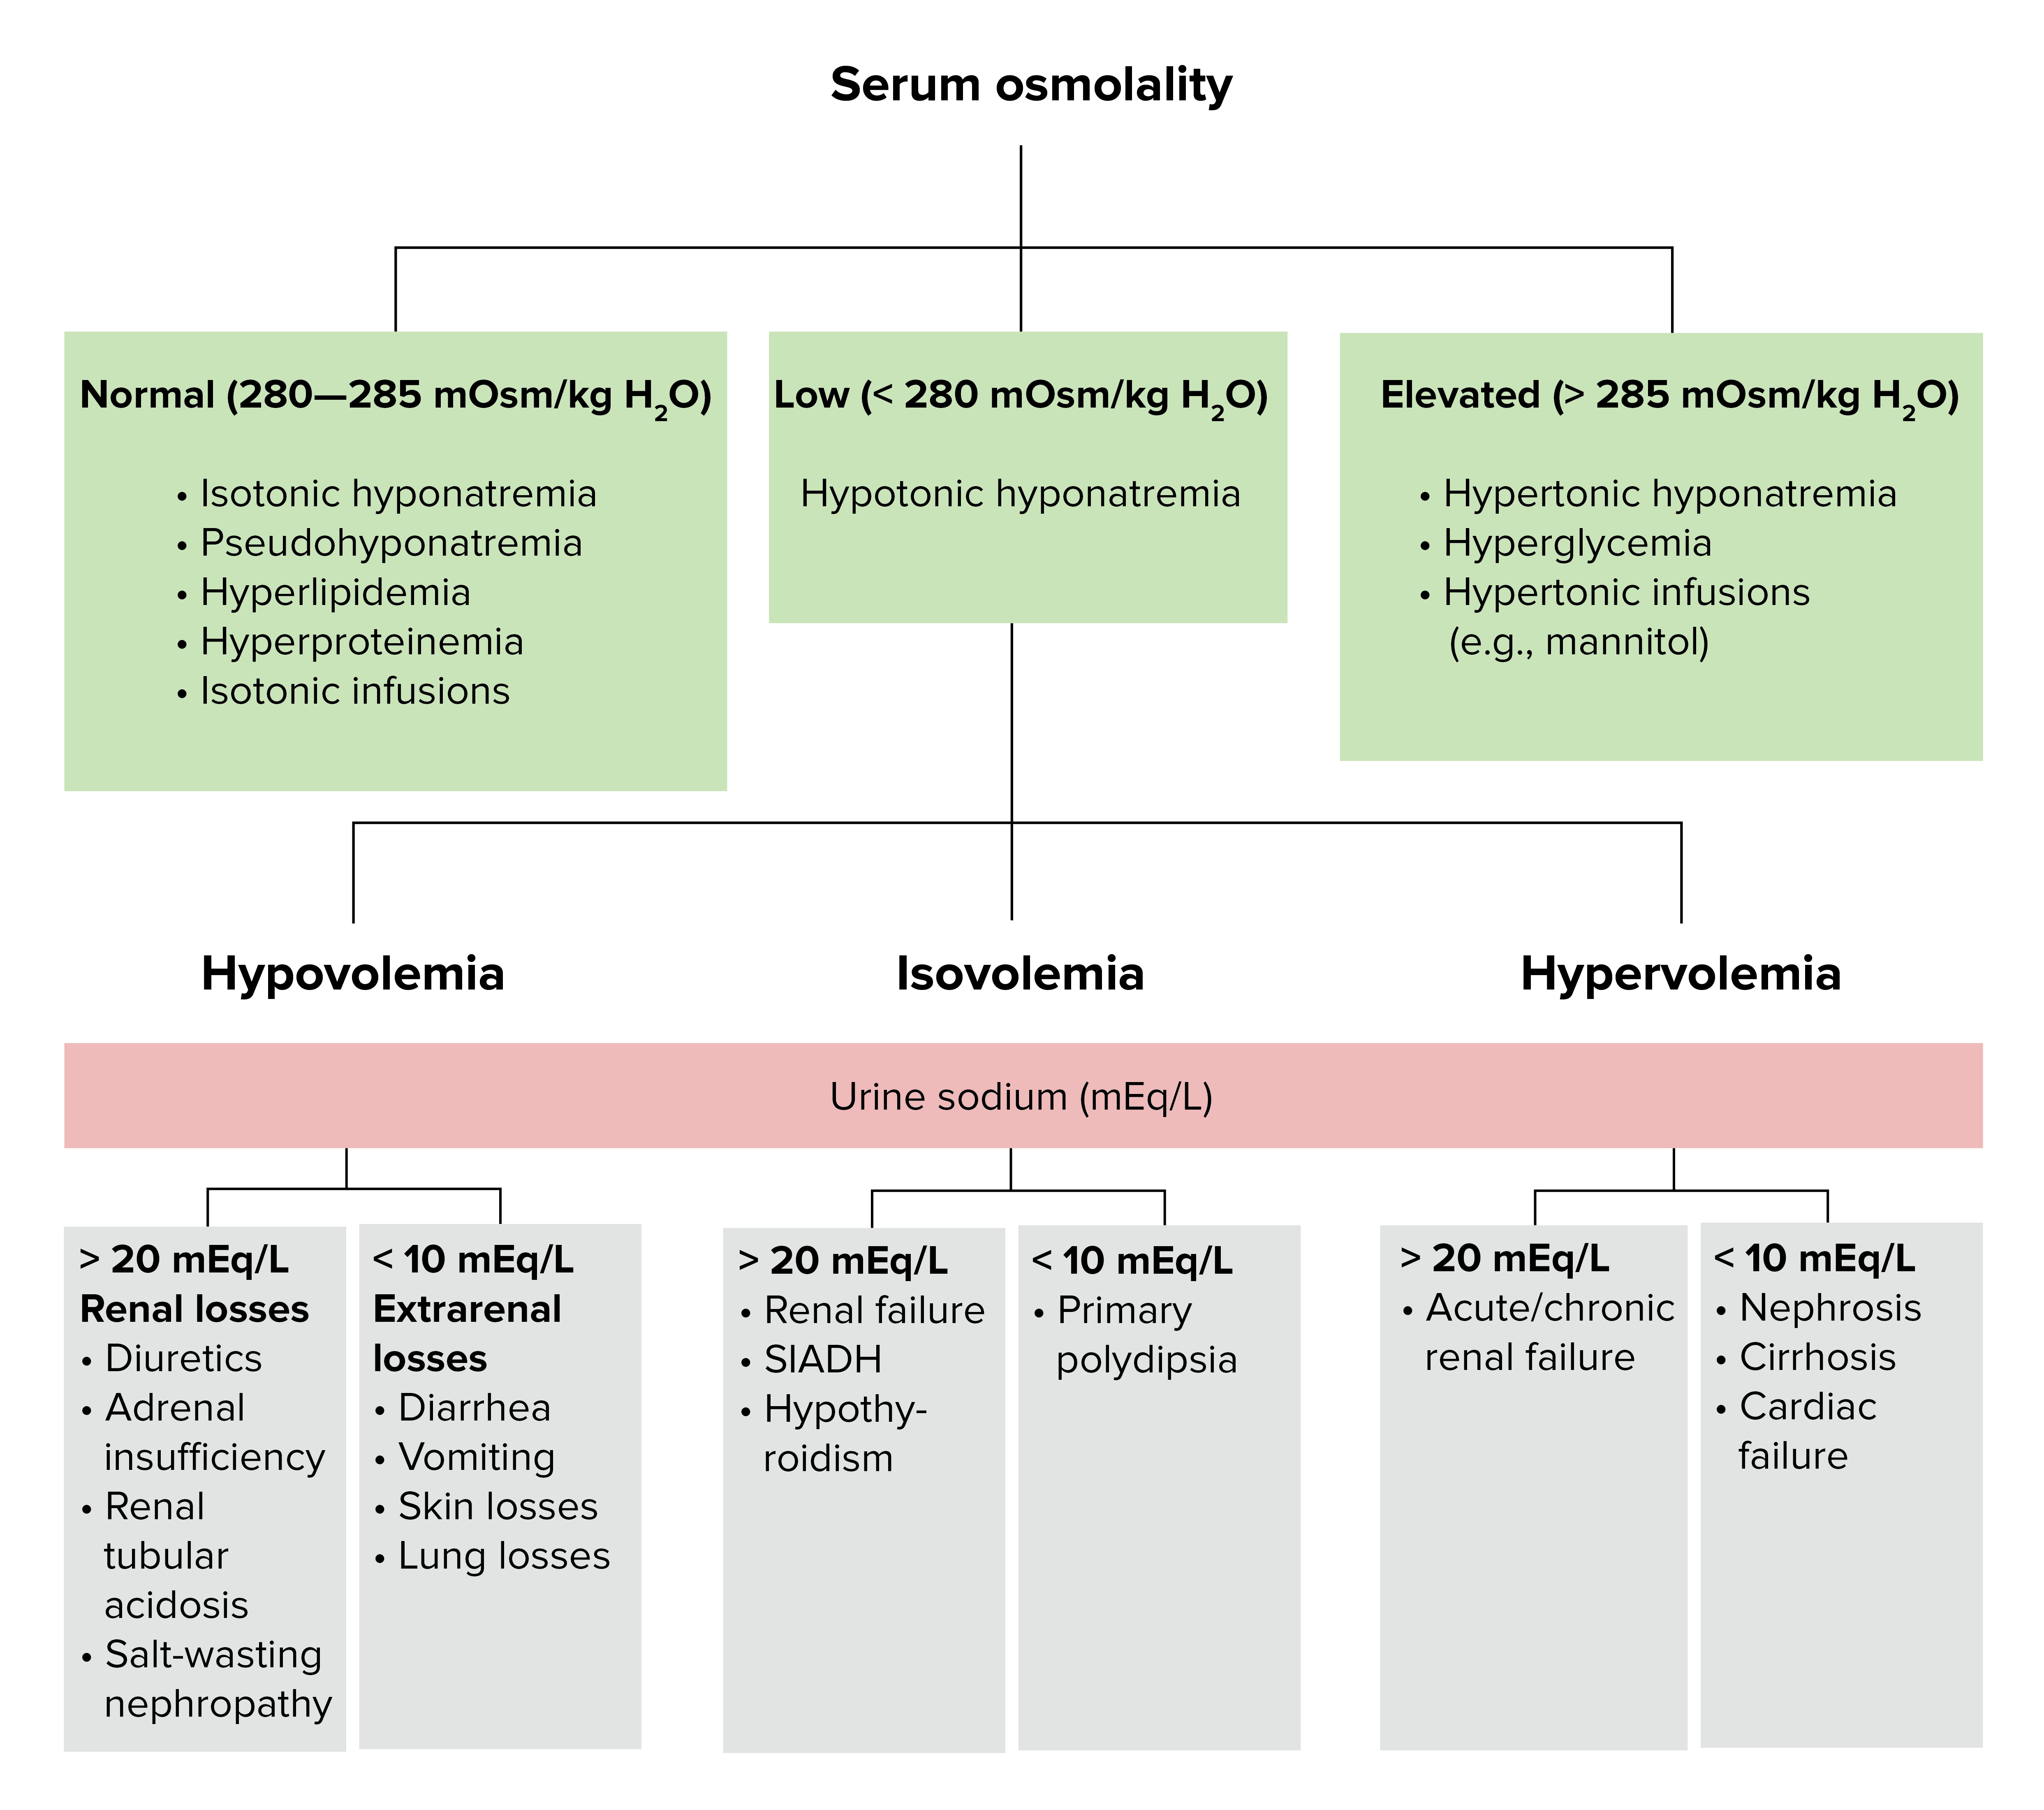
00:01 Beautiful table here for us to truly understand. 00:04 Do you remember those wheels of life? And by that I mean, we took a look at two circles, one circle was dealing with tonicity and the other circle was dealing with volume. Do you remember that? And I told you at that time with the circles that you wanted to pay attention to the tonicity first because that becomes of upmost priority and importance within our body on a day-to-day breath-by-breath moment, With that said, tonicity, what was the hormone that was responsible for properly monitoring or regulating your tonicity? I believe it is ADH. That is correct. 00:43 And osmoreceptors, remember all of that also plays a role as we discussed in the very beginning of this lecture. Let us take all this into consideration. I want to set up this graph. You see it first and then we are going to walk through the verbiage, not vice versa. I want you to see it first, then we will walk to the words. Otherwise, I am wasting your time. On the X-axis is your percentage change. On your Y-axis, actually says plasma ADH. So as you move up the Y-axis, you are increasing your plasma ADH and the X-axis represents the percentage change that is occurring. Now, that is just the parameters. Let us now make sense of all this, what I really need to also pay attention to is the actual terminology here, that yellow golden lines solid and linear fashion that you are seeing there is your isotonic osmotic increase. I would like for us to work on that first, please. That linear relationship that you see on the golden line there represents for every percentage increase in tonicity. 01:53 You find a linear increase of your ADH. So even a little bit of increase of your osmolarity tells your osmoreceptors and signals the release of ADH. That is how important as I said plasma osmolarity is to you and how important it is to regulate that. Okay. If that is the case and that is your osmotic line, what is the green curve that we are seeing? Well go up to the key and in the key, you'll noticed that this is isotonic volume depletion. 02:28 Do you see as to how I emphasize depletion? So the percentage change here on your X-axis is representing volume loss percentage. 02:40 you will notice that here. Take a look at the red box now. That red box as you move from zero on the X-axis, 0, 5, 10. 02:50 That's ten percent. Now for volume, that means that you have lost up to or greater than ten percent. I want you to move up now, the Y-axis you will notice. Please notice between 0 and 10 percent was there much of a change on your Y-axis? Look. Once again between 0 and 10 were there much of a change on your Y-axis? No there wasn't. It was pretty flat. It means the ADH remained at a relatively constant level maybe it increased a little bit, but my goodness you go beyond 10 percent loss of your volume, you almost find not just a linear, but hyperbole type curve in which you have a massive release in ADH because the volume must be replenished because your patient is in severe hypovolemic shock. With all that said, let us now walk you through the verbiage that we see here. They're controlled by the hypothalamic osmoreceptors. Who is? ADH secretion. That is the theme of this slide. 03:54 ADH secretion stimulated by plasma osmolarity. Plasma hypovolemia. Stop there. That is the big deal now, isn't it? When do you have hypovolemia that finally releases ADH? That is the big point. 04:11 That is the green line. That is the green curve. It is only when you lose greater than 10 percent in which plasma hypovolemia will release ADH. 04:22 that is going to be angiotensin II. Remember the angiotensin II was on the wheel of your volume and that was dealing with sodium and company. You only have that crossover effect with angiotensin II. So, therefore, that also becomes extremely important. Let us move on ADH inhibition. So if hyperosmolarity within the plasma, therefore, released ADH, you will notice you have hypo-osmolality. In other words, your plasma is diluted thus you are going to inhibit ADH and plasma hypervolemia, the opposite. They are also though, would be, well we will take a look at a graph in a little bit where 10 percent becomes interesting. 05:06 So at this point though, your focus should be on volume loss and only after you have understood everything that I have said, you will go into hypervolemia, but not before that, please. Now, overall physiologic range of effective circulating volume, what that represents is from 0 to 10 percent X-axis and you don't have much of a change in ADH with volume. In general, only volume depletion now here is the point. Take a look at where now we have had a blank from 0 to 10. The 10 has now been boldened and look at the verbiage. The words are saying here depletion of greater than 10 percent has a severe stimulation of ADH release and hence you find that the green curve is now taking a drastic increase on your Y-axis. What happen here? Hypervolemic shock
About the Lecture
The lecture Regulation of ADH: ADH Secretion by Carlo Raj, MD is from the course SIADH.
Included Quiz Questions
Which of the following parameters would increase the secretion of antidiuretic hormone in a patient with normal blood pressure?
- Plasma hyper-osmolality
- Urine hypervolemia
- Plasma hypervolemia
- Plasma hypo-osmolality
- Plasma uric acid levels
Which of the following stimuli is most likely responsible for the release of ADH in hypotension?
- Angiotensin II
- Glucose
- Uric acid
- Aldosterone
- Cortisol
Which of the following statements is correct regarding the regulation of ADH?
- ADH levels are determined almost entirely by plasma osmolarity.
- ADH secretion is stimulated by plasma hypo-osmolality.
- ADH is released from the anterior hypothalamus in response to decreased plasma osmolality.
- Under normal conditions, angiotensin-II is the most important regulator of ADH release.
- ADH release is triggered by activation of osmoreceptors in the anterior pituitary.
Which of the following parameters is increased in response to the activation of osmoreceptors in the hypothalamus?
- Thirst
- Inhibition of V2 receptors.
- Activation of V1 receptors.
- Urine volume
- Plasma osmolality
Which of the following mechanisms stimulate the release of ADH?
- Plasma hyperosmolality
- Plasma hypo-osmolality
- Plasma hypervolemia
- Urine hypervolemia
Which of the following inhibits the secretion of ADH?
- Plasma hypo-osmolality
- Plasma hyperosmolality
- Plasma hypovolemia
- Angiotensin II
Which of the following will not significantly influence the levels of ADH?
- Volume depletion of less than 10%
- Volume depletion of at least 10%
- Volume depletion of greater than 10%
- Volume depletion of at least 20%
- Volume depletion of at least 15%
Author of lecture Regulation of ADH: ADH Secretion

Carlo Raj, MD
Customer reviews
5,0 of 5 stars
| 5 Stars |
|
5 |
| 4 Stars |
|
0 |
| 3 Stars |
|
0 |
| 2 Stars |
|
0 |
| 1 Star |
|
0 |
