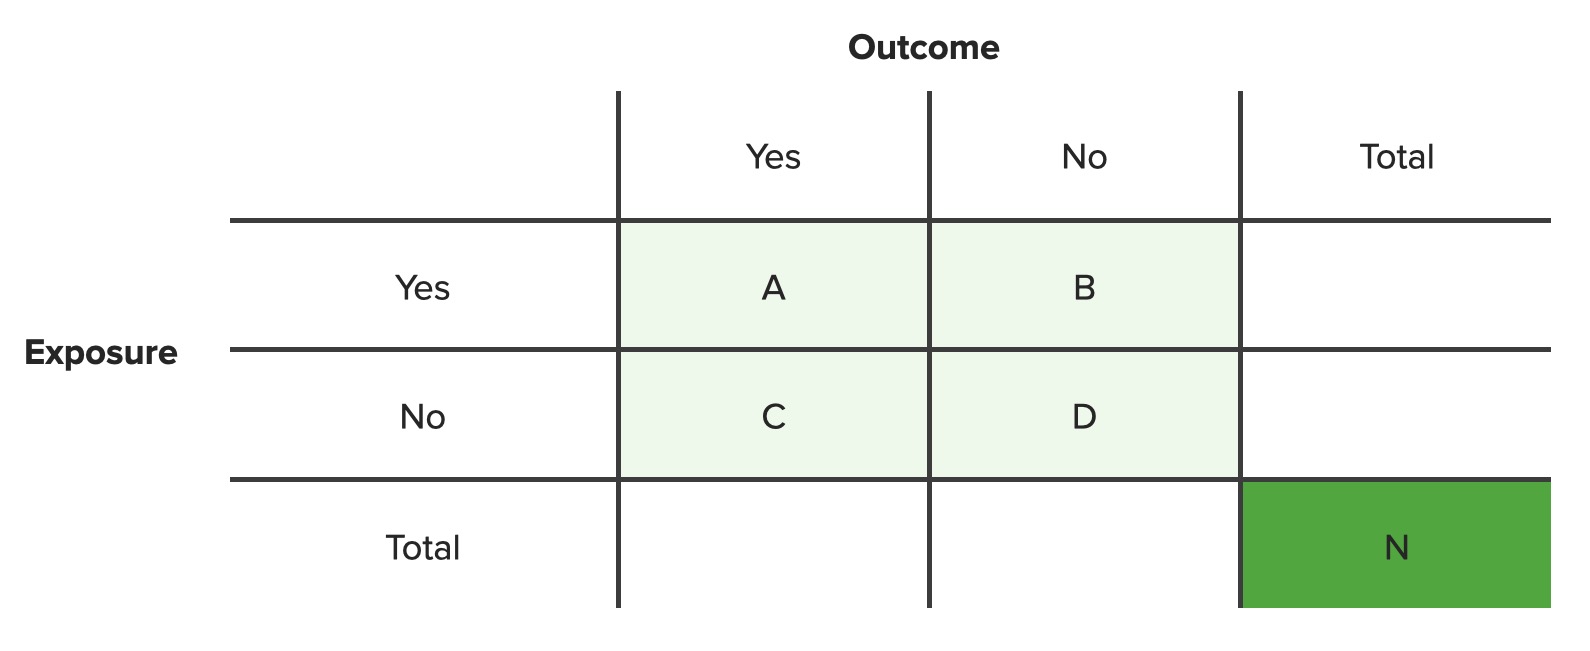
Table and explanation visible at the same time
By Cassandra W. on 10. March 2024 for Probability Models
I think it would’ve been easier to follow if the table that he’ refers to is visible at the same time he’s giving the explanation..
Thanks
By Hau P. on 13. October 2021 for Statistics Part 1
Great video with easy explanation
The good page for learning
du
By Mohamad A. on 13. September 2021 for Summarizing Quantitative Variables
The explanation is smooth and clear. However, I think it would have been better if the common sense behind the formulas (especially the standard deviation) was explained in more detail so we can understand how the formulas work a little more deeply.
I like it
By Mohamad A. on 30. August 2021 for Statistics Part 1
The explanation is really good and entertaining. Some points require more different examples to be better understood.
It wasn't bad
By Zenya B. on 19. July 2021 for Statistics Part 1
Straight forward way of teaching however he has a monotone personality
CONFUSING
By Michalis N. on 11. November 2020 for Summarizing Quantitative Variables
Its Pretty confusing. Ofc I am a person I ve never had any experience with statitics but during the lecture is so easy to lose pace. Lecture number 1 was easier to get because of the Age-Education as paradigm instead of soulless numbers.!
In addition its really confusing when the examples are made with data from the previous slide, witch you dont see any more but you require it to proceed.
Length of the videos
By Ariel B. on 09. October 2020 for Statistics Part 1
Lecture are a bit too long... Probably better to separate it to more but shorter videos
Very thorough
By Sana Q. on 28. August 2020 for Statistics Part 2
I especially enjoyed the examples, they cleared up concepts far faster than brute memorisation could
prob
By Michael b. on 11. July 2020 for Introduction to Probability
good overview and a clear into to the topic good speaker
Excellent presentation, application of concepts is good, and will recommended for self
By Surajudeen S. on 26. June 2020 for Statistics Part 1
Excellent presentation, application of concepts is good, and will recommended for self
Very knowledgeable. Very informative
By Kirti P. on 16. August 2018 for Introduction to Statistics
It's good and very informative. The introduction of the statistics.. was to the point and appropriate.
The best USMLE Biostatistics resource I've found so far
By joshua W. on 17. July 2018 for Learn Statistics - Become Data Smart
So for a reference, I´m an MS2 preparing for step 1, and the biostatistics at my school is not very good. I´ve used Jeckel´s, UWORLD statistics questions, and First Aid. A lot of students write off statistics as a low yield subject, but I think (from what others have told me) is to score high you need to be fairly strong in all areas, and plus you want to make a solid doctor and learn the material regardless. Out of the resources I´ve used (correct me if there are better out there) that this is by far a cut above the other resources for the USMLE. He explains the concepts in a clear and easy way to understand, and more than equips you with the tools you need to go out there and ace the UWORLD, Kaplan, etc. questions. The Lecturio lecturers range from not to good to amazing, and I would highly recommend to watch this series through for any medical student, health sciences or premedical student taking a biostatistics class, or for anyone who wants to understand medical statistics a little better.
This lecture is the best.
By Arah G. on 06. June 2018 for Introduction to Statistics
This lecture is the best. I didn't struggle understanding the lesson.
Great Lecturer
By Curtis u. on 14. January 2018 for Introduction to Statistics
Clear and concise presentation. Questions follow the material as presented.
Standardizing Data and the Normal Distribution Part 2
By Lourdes K. on 20. October 2017 for Standardizing Data and the Normal Distribution Part 2
I learned a lot with this lecture.
Really, I like the way of explanation.
I will recommend this lecture to everybody who is really wanted to study statistics.
like
By Lourdes K. on 18. October 2017 for Contingency Tables
It is better than that I watched in other web site. I really recommend this lecture.
The course works for me.
By Ruby W. on 10. October 2017 for Statistics Part 1
I have never learn statics in my life before, I am a complete beginner. I can follow the teacher's pace. My favorite part is the examples which help to understand and practice.
Great lecture
By Fungai M. on 25. June 2017 for Contingency Tables
Clear explanations that makes understanding of concepts easy. Relevant examples too
Excellent
By Kelvin F. on 16. June 2017 for Statistics Part 1
Excellent lectures. Concise, straight to the point, and very accurate explanations.
Excellently explained
By Denvon B. on 28. April 2017 for Introduction to Statistics
The lecture was informative, straight to the point and clear.
Dr. Spade is awesome!
By Smirnov E. on 01. April 2017 for Learn Statistics - Become Data Smart
Dr. Spade is an amazing lecturer, I have taken statistics at least twice and this the first time that I have gotten a grasp of it
He is explaining great
By Anton S. on 21. January 2017 for Summarizing Quantitative Variables
He is explaining great ! Little bit fast sometimes, but it is first time that i understand statistics.
Dr
By Warren L. on 15. January 2017 for Summarizing Quantitative Variables
Dr. Spade has a very practical way of explaining these concepts, without confusion. Much detail is provided and the process is smooth. Thanks Doc.
No Exercises
By Cleide G L B. on 10. January 2017 for Summarizing Quantitative Variables
The teacher is good, but he giver no exercises so we can practice and the lectures end up being quite boring
great examples and I like how suddenly there is a quiz the quiz
good work
By sarah n. on 20. December 2016 for Introduction to Statistics
great examples and I like how suddenly there is a quiz the quiz
good work
This was a waste of time . Please put the tables on each slide if you expect us to follow what you are saying.
By C J S. on 17. July 2016 for Learn Statistics - Become Data Smart
This was awful. The instructor is rattling off numbers and asking us to answer questions which refer to tables which we can't see because they are not posted. I don't know about you, but I can't visualize a table of new data for a few seconds and then answer questions on the data within a platform which is supposed to teaching a new concept. He seems like a knowledgeable man but this was not well thought out.