


Um eletrocardiograma ( ECG ECG An electrocardiogram (ECG) is a graphic representation of the electrical activity of the heart plotted against time. Adhesive electrodes are affixed to the skin surface allowing measurement of cardiac impulses from many angles. The ECG provides 3-dimensional information about the conduction system of the heart, the myocardium, and other cardiac structures. Electrocardiogram (ECG)) é uma representação gráfica da atividade elétrica do coração em função do tempo. Os eletrocardiogramas são simples, baratos, não invasivos e de fácil obtenção. Os elétrodos adesivos são fixados na superfície da pele, permitindo a medição dos impulsos cardíacos de vários ângulos. O ECG ECG An electrocardiogram (ECG) is a graphic representation of the electrical activity of the heart plotted against time. Adhesive electrodes are affixed to the skin surface allowing measurement of cardiac impulses from many angles. The ECG provides 3-dimensional information about the conduction system of the heart, the myocardium, and other cardiac structures. Electrocardiogram (ECG) fornece informações tridimensionais sobre o sistema de condução do coração, o miocárdio e outras estruturas cardíacas. No estado saudável, um ECG ECG An electrocardiogram (ECG) is a graphic representation of the electrical activity of the heart plotted against time. Adhesive electrodes are affixed to the skin surface allowing measurement of cardiac impulses from many angles. The ECG provides 3-dimensional information about the conduction system of the heart, the myocardium, and other cardiac structures. Electrocardiogram (ECG) regista ondas e complexos previsíveis e reprodutíveis, que correspondem a eventos fisiológicos eletromecanicamente acoplados no coração. Sob condições patológicas, o ECG ECG An electrocardiogram (ECG) is a graphic representation of the electrical activity of the heart plotted against time. Adhesive electrodes are affixed to the skin surface allowing measurement of cardiac impulses from many angles. The ECG provides 3-dimensional information about the conduction system of the heart, the myocardium, and other cardiac structures. Electrocardiogram (ECG) pode detetar arritmias, isquemia, inflamação e muito mais MAIS Androgen Insensitivity Syndrome.
Last updated: Dec 15, 2025
Em 1902, o eletrocardiograma ( ECG ECG An electrocardiogram (ECG) is a graphic representation of the electrical activity of the heart plotted against time. Adhesive electrodes are affixed to the skin surface allowing measurement of cardiac impulses from many angles. The ECG provides 3-dimensional information about the conduction system of the heart, the myocardium, and other cardiac structures. Electrocardiogram (ECG)) foi inventado por Willem Einthoven, um médico holandês. Einthoven recebeu o Prémio Nobel de Fisiologia ou Medicina de 1924 por esta invenção.
O eletrocardiograma é abreviado/referido como:
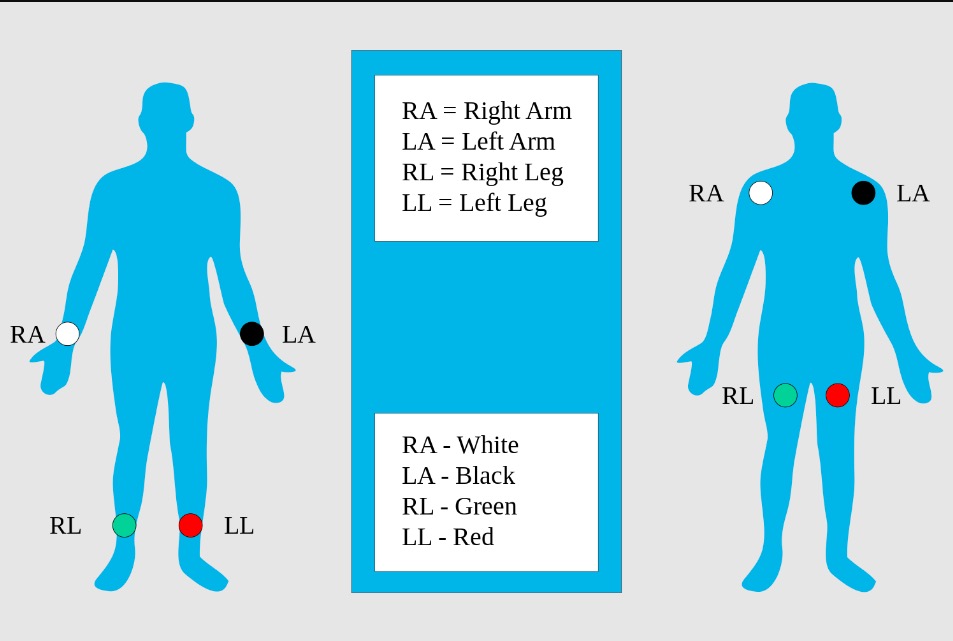
Elétrodos dos membros: posicionamento padrão dos elétrodos dos membros (imagem à esquerda) e posicionamento modificado (imagem à direita) para ECG
Imagem : “Limb leads, standard placement of the limb leads for electrocardiography” por MoodyGroove. Licença: Public Domain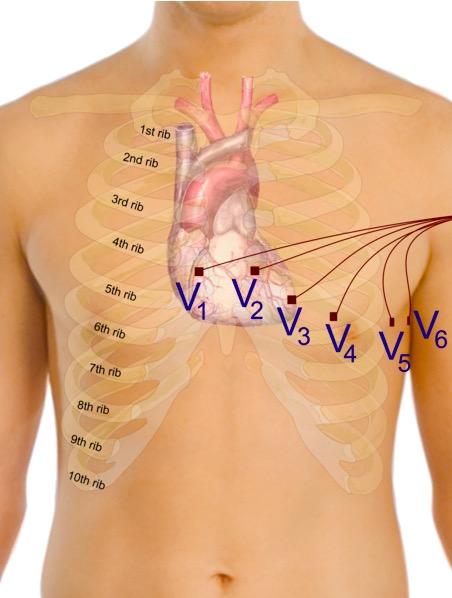
Colocação adequada dos elétrodos precordiais para o ECG
Imagem : “Precordial leads in ECG” por Mikael Häggström. Licença: CC0 1.0
Triângulo de Einthoven
Imagem : “Einthoven triangle” por Katrin Litzkow. Licença: Public Domain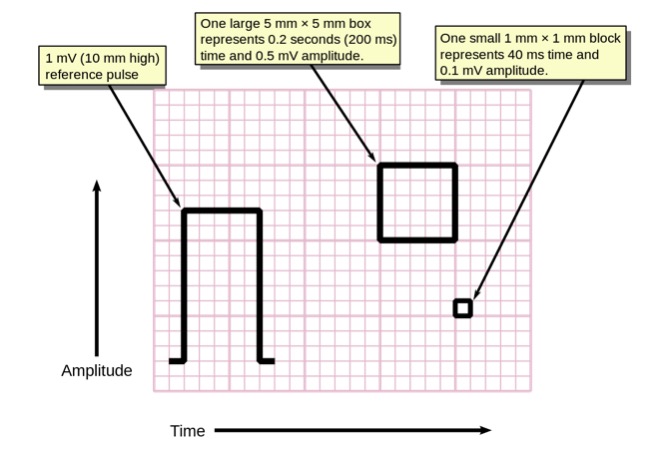
Pulso de voltagem do ECG e tamanho dos quadrados
Imagem : “Measuring time and voltage with ECG graph paper” por Markus Kuhn. Licença: Public DomainUm traçado de ECG ECG An electrocardiogram (ECG) is a graphic representation of the electrical activity of the heart plotted against time. Adhesive electrodes are affixed to the skin surface allowing measurement of cardiac impulses from many angles. The ECG provides 3-dimensional information about the conduction system of the heart, the myocardium, and other cardiac structures. Electrocardiogram (ECG) normal terá vários componentes previsíveis e reprodutíveis correspondentes a eventos eletromecânicos no ciclo cardíaco.
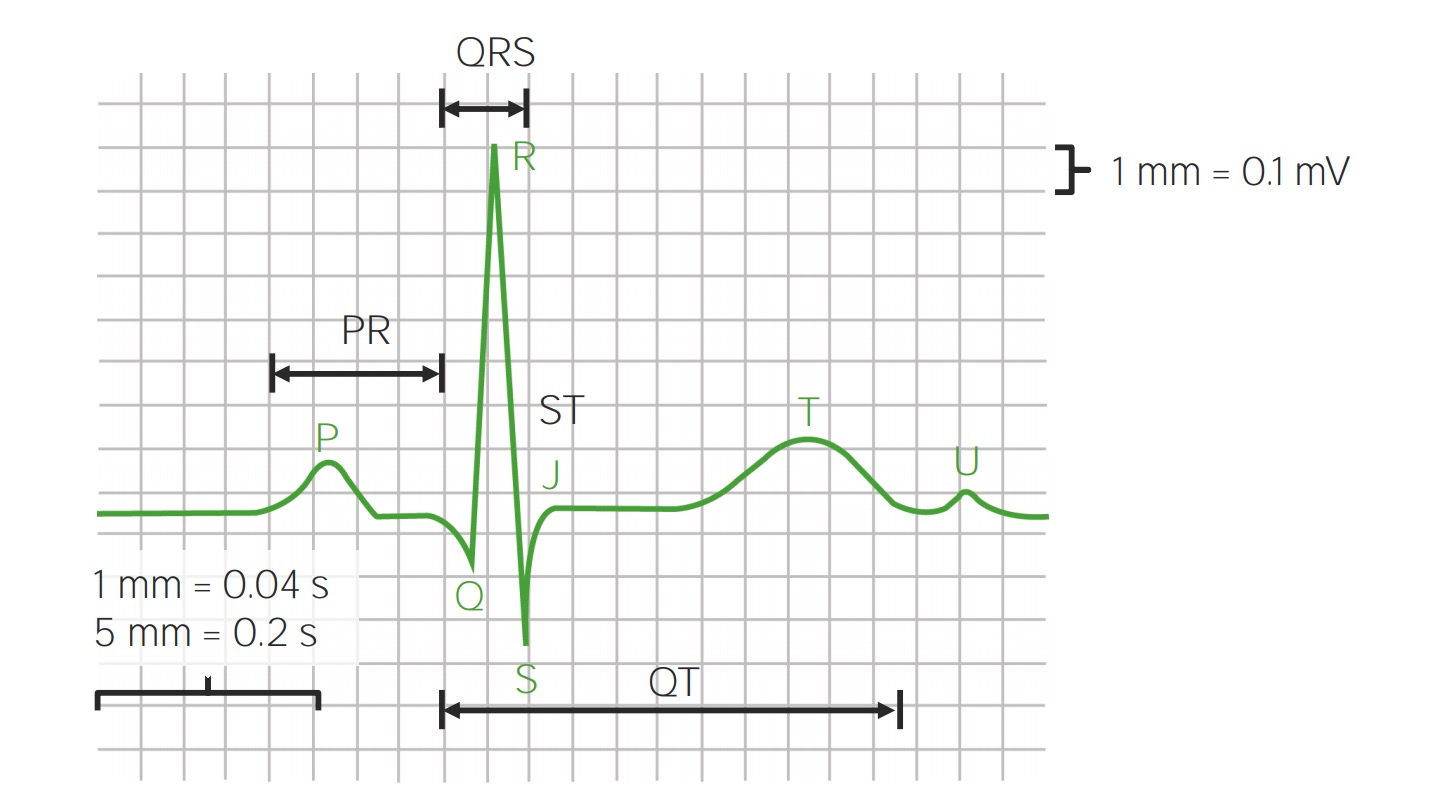
Partes do formato da onda no ECG e intervalos
Imagem por Lecturio. Licença: CC BY-NC-SA 4.0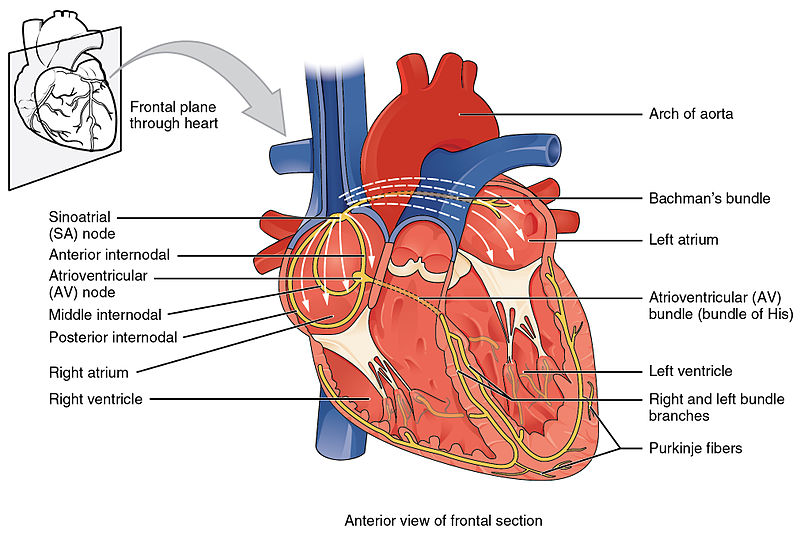
Corte transversal do coração que mostra o sistema de condução
Imagem : “Conduction System of Heart” por OpenStax College. Licença: CC BY 3.0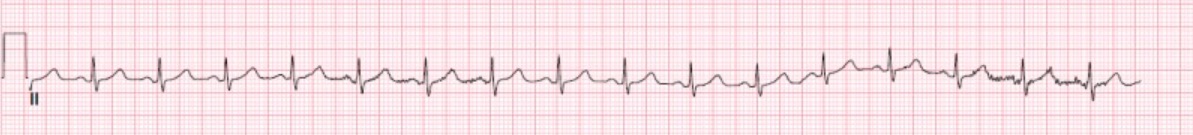
Tira de ritmo da derivação II normal com barra de voltagem padrão
Imagem : “Normal EKG” por StatPearls Publishing LLC. Licença: CC BY 4.0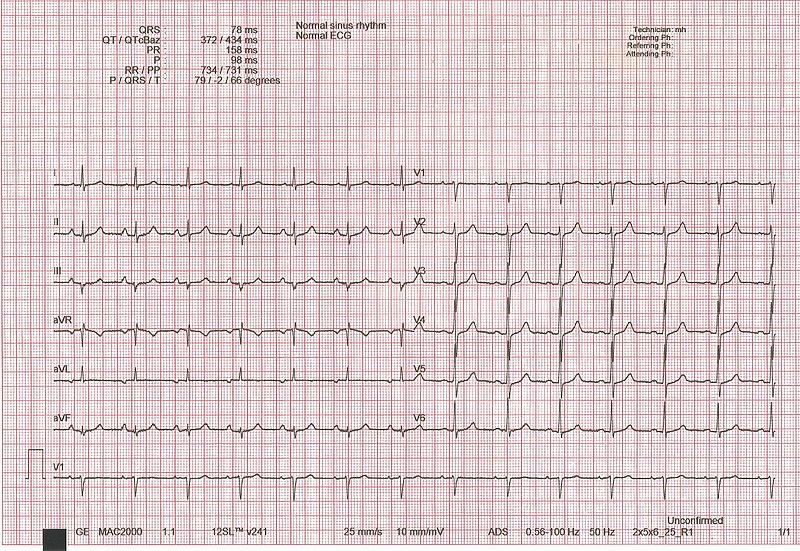
ECG normal: traçado de 12 derivações com uma faixa de ritmo V1 exibida na parte inferior
Imagem : “ECG interpretation” por Rodhullandemu. Licença: Public Domain