Playlist
Show Playlist
Hide Playlist
Diagnosis: Spirometry – Lung Disease

-
Slides 06 Respiratory Medicine Basics Brown.pdf
-
Download Lecture Overview
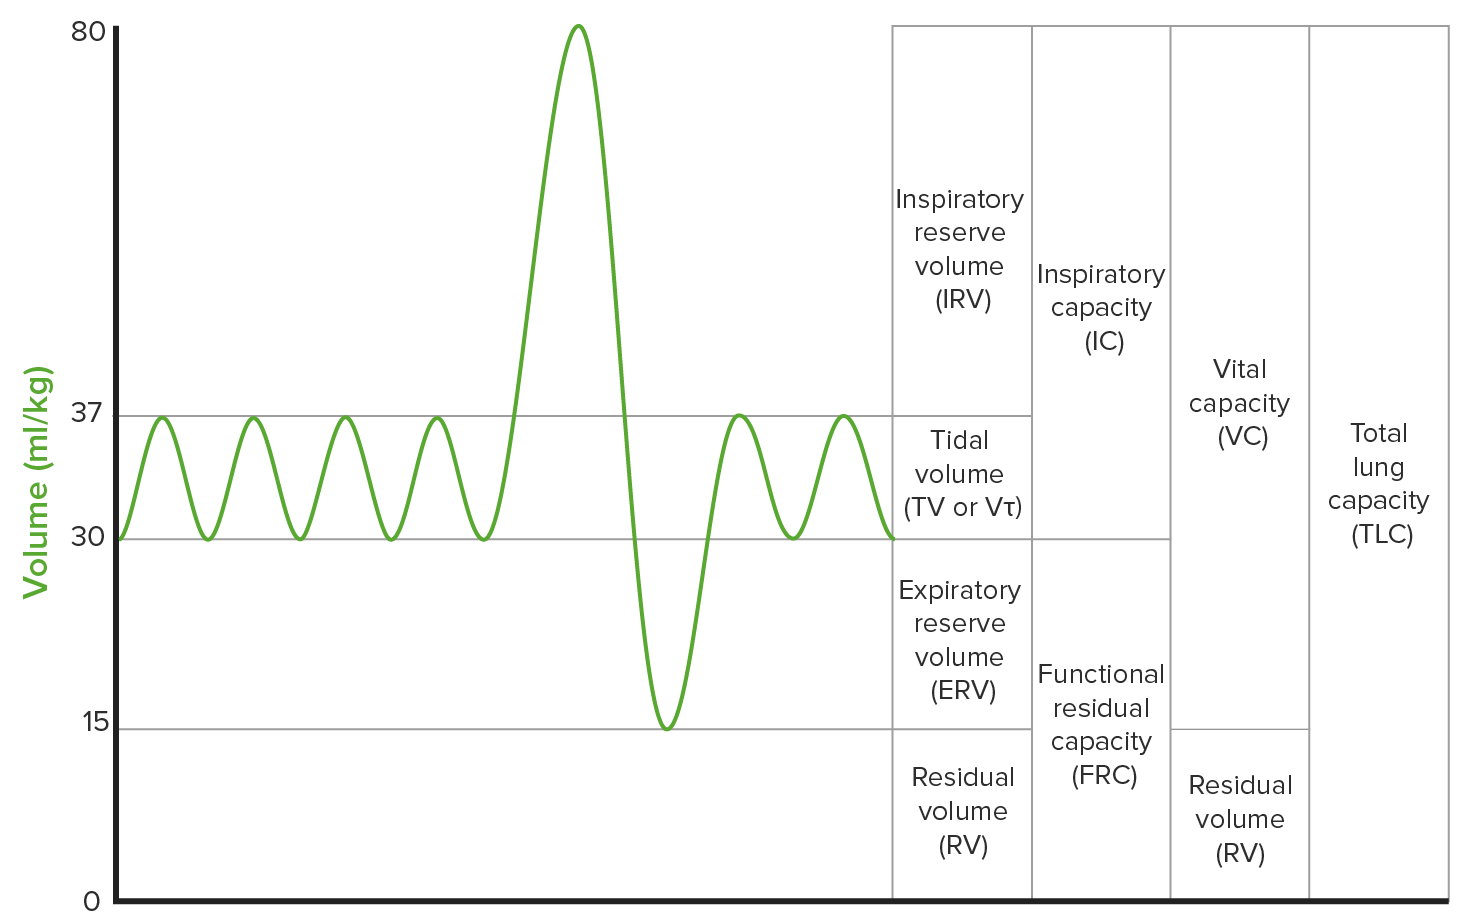
00:02 So I’m going to concentrate largely on lung-function tests in this lecture. And these include the peak flow, the spirometry, lung volumes and transfer factor. They describe how good the patient’s lungs are at getting oxygen into the blood, how good – how large the lungs are, how much air can be moved during inspiration and expiration. 00:24 They are largely dependent on patient effort. So if the patient can cooperate and do the test well, you’ll get much more accurate results. And one of the major problems with lung-function tests is that people are not able to do them effectively and therefore you can’t get data from them. 00:40 We normally use the best-of-three attempts for each type to get the most appropriate answer as to the patient’s lung function. 00:51 If they’re normal, that largely excludes significant respiratory function impairment. 00:55 So they’re very useful in patients presenting with breathlessness of unknown cause. And if you do full lung-function testing and they’re all normal, then you can probably say it’s not a lung problem. 01:04 And also they are the essential method for monitoring chronic lung disease such as COPD or interstitial lung disease over time. 01:14 The values that you get from lung-function tests are expressed in two ways: one is an absolute value – the absolute number. But also they’re expressed as a percentage of expected. And that is because your lung-function value depends on your age, sex and height. 01:26 A young man who is 6ft4 will have considerably different lung volumes to an 80-year-old woman who is 5ft2, for example. So you need to have a feel for what the expected values will be for each person’s age, sex and height. And those are available in tables. 01:43 As I said, the normal values are altered by age, your sex, your height and also they’re affected by ethnicity. But the data for that are poor and there’s no clear indication about the effects of ethnicity on lung function. 01:59 So the first lung-function test is the peak flow. This is measured using a handheld portable device. Therefore you can use it frequently. You can repeat it multiple times within a day if necessary. And what it measures is the maximum flow measured in litres per minute on a forced expiration. It identifies patients with airways obstruction, whether it’s upper airways or lower airways. 02:20 Because it’s portable and can be used repeatedly, it’s actually very good for people to take home and therefore you can use it to identify people with variable airflow obstruction. 02:32 That means they have asthma. And indeed the peak flow correlates with the severity of asthma and it’s very useful for monitoring how they’re doing with their treatment and how severe they are when they present with an exacerbation. It’s not so good for patients with other forms of airflow obstruction such as COPD because it doesn’t vary much even with the patient’s condition varying. It’s also good for identifying patients with large airways obstruction. 02:56 So an example: this is a 30-year-old man. He has asthma. His best peak flow is 650 L/min. 03:00 He comes to hospital because he’s having an exacerbation of asthma with increased cough and wheeze. If you measure his peak flow and it’s 450 L/min, that’s fallen by 200. 03:11 That’s a pretty major deterioration but it’s not life threatening. So this is a moderately severe attack. With treatment – with bronchodilators – he should get better and should be able to either return home that evening or, perhaps, stay in for a short period of time. 03:25 However, if you do the peak flow and it’s 150 L/min, that puts him immediately into a very severe attack and a potentially life-threatening situation. And you would not let that patient go home until his peak flows have been stable for a day or two at least. 03:39 If he comes back to outpatients after having been in hospital for a while and he shows you the peak flows he’s been recording at home and you see that actually in the morning it’s 500-550 and in the evening it’s 600-650, that’s quite a big difference. That’s 100 L/min difference between morning and evening. And that’s what we call diurnal variation. 03:55 And that indicates that his asthma is not well controlled and that he may need increasing health therapy to try and iron out that difference between the morning and the evening result and therefore show that the disease is better controlled. 04:13 So the other simple lung-function test we do is spirometry. This requires however a handheld or a lab-based machine. It’s a bit more difficult to do. It requires a forced manoeuvre where people breathe out as hard as they can for as long as they can. And it’s not therefore very readily reproducible to be repeated several times a day for example. 04:31 It gives you two parameters: the forced expiratory volume in one second – that is a flow rate, a bit like the peak flow – and the forced vital capacity – that’s the total volume expired from the lungs. So that’s basically the measure of how much air somebody can move in and out of their lungs when they do a forced inspiration and a forced expiration. The other parameter it gives you is the ratio between the two. Because the FEV1 tends to fall when you have airways obstruction to a greater level than the FVC. And therefore the ratio between the two becomes lower. And that’s called an obstructive disorder. And the ratio, if it’s less than 80%, indicates an obstructive problem with the spirometry. Whereas if it remains greater than 80% - and in fact with many diseases it becomes 90-95% - that suggests a restrictive problem. 05:29 If somebody has obstructive spirometry, then the very important question is whether this is reversible. So is that abnormality in FEV1 recoverable if the patient is given treatment with bronchodilators? Because that identifies patients with reversible airways disease – asthma – or irreversible airways disease such as COPD. 05:48 These are three different examples: the spirometry, the one you can see on the left-hand side of the slide, is what a normal spirometry may look like. The middle one is somebody who has a reversible airways obstruction – so the black line is where they have no treatment and you can see that their FEV1 has fallen quite a lot: it’s 1.2 whereas the estimated normal would be 3.8 for this patient for example. But then you give them a bronchodilator and the FEV1 has improved substantially. So that’s a bit of reversible airways disease but, importantly, it hasn’t reversed back up to normal levels. And the last one shows somebody with restrictive spirometry. And this is where they have a chronic lung disease like pulmonary fibrosis where the lungs are small but the airflow is maintained. And you can see that the FEV1 and the FVC are very close to each other and therefore the ratio is about 90-95% in these circumstances. 06:43 So all of the causes of obstructive and restrictive lung function. Obstructive is as it says: it’s airways disease with obstruction. So COPD, a largely irreversible disease. Asthma would be a largely reversible disease. Other airways diseases: bronchiectasis, rarer causes of lower airways obstruction, upper airways disease. 07:01 Restrictive lung function: actually anybody who does not put the full effort in doing a spirometry manoeuvre will come out with what looks like a restrictive lung function result. So poor effort during the test will leads to what looks like restrictive lung function but that can be seen when you observe the patient during the test. 07:21 Interstitial lung disease, pulmonary fibrosis, post-infective scarring of the lung, pleural effusions, pleural thickening, anything that affects the chest wall will all cause restrictive lung disease. 07:30 Sarcoidosis and hypersensitive pneumonitis, they’re both interstitial lung diseases which cause restrictive changes. But there’s often an obstructive element causing a mixed restrictive-obstructive picture. And a mixed restrictive-obstructive picture also occurs if you have somebody with more than one disease present. So, for example, pulmonary fibrosis commonly occurs in smokers, COPD commonly occurs in smokers and therefore you often get patients who have pulmonary fibrosis and COPD. And their lung function reflects that by having a mixed restrictive-obstructive picture. 08:05 So some examples of how you use spirometry. This is examples of how you use spirometry over time because it’s the most useful way of monitoring how the patient’s lung function is doing in a chronic lung disease over time. 08:19 So, for example, on the left-hand side we have somebody who’s got stable COPD with his FEV1 being repeated every six months or so and showing very similar values. They’re not deteriorating. They stopped smoking, they’re on inhalers, they’re doing reasonably well. 08:33 The middle patient is somebody with asthma. And again the FEV1 seems to be stable between month 1 and month 24. But if you look back at the results, month 7 it was much lower and that reflects an exacerbation that occurred at that time but then they got treated and the FEV1 came back up to where it should be. 08:48 The right-hand side is somebody with progressive COPD. And the FEV1 starts off at the same level. It’s a stable patient. But you see it falls. And it falls by a little bit each time but that means that, after 24 months, it’s fallen by 300 ml. That’s 150 ml per year. And if it carries on falling at that rate, the patient will be in respiratory failure within 5 to 6 years.
About the Lecture
The lecture Diagnosis: Spirometry – Lung Disease by Jeremy Brown, PhD, MRCP(UK), MBBS is from the course Introduction to the Respiratory System.
Included Quiz Questions
All of the following parameters can physiologically alter spirometry results, except the...?
- ...abdominal circumference.
- ...age.
- ...sex.
- ...height.
- ...race.
Regarding spirometry results, which of the following can be interpreted from a FEV1/FVC ratio < 70%?
- An obstructive disorder is present.
- A restrictive disorder is taking place
- Normal
- Severe lung disease
- More information is required to make an interpretation.
Which of the following is a RESTRICTIVE lung disease?
- Pulmonary fibrosis
- Asthma
- Bronchiectasis
- COPD
- Tracheal tumor
Author of lecture Diagnosis: Spirometry – Lung Disease

Jeremy Brown, PhD, MRCP(UK), MBBS
Customer reviews
5,0 of 5 stars
| 5 Stars |
|
5 |
| 4 Stars |
|
0 |
| 3 Stars |
|
0 |
| 2 Stars |
|
0 |
| 1 Star |
|
0 |
