Playlist
Show Playlist
Hide Playlist
Epidemiology and Statistics

-
Slides 03 Statistics Epidemiology.pdf
-
Reference List Epidemiology and Biostatistics.pdf
-
Download Lecture Overview
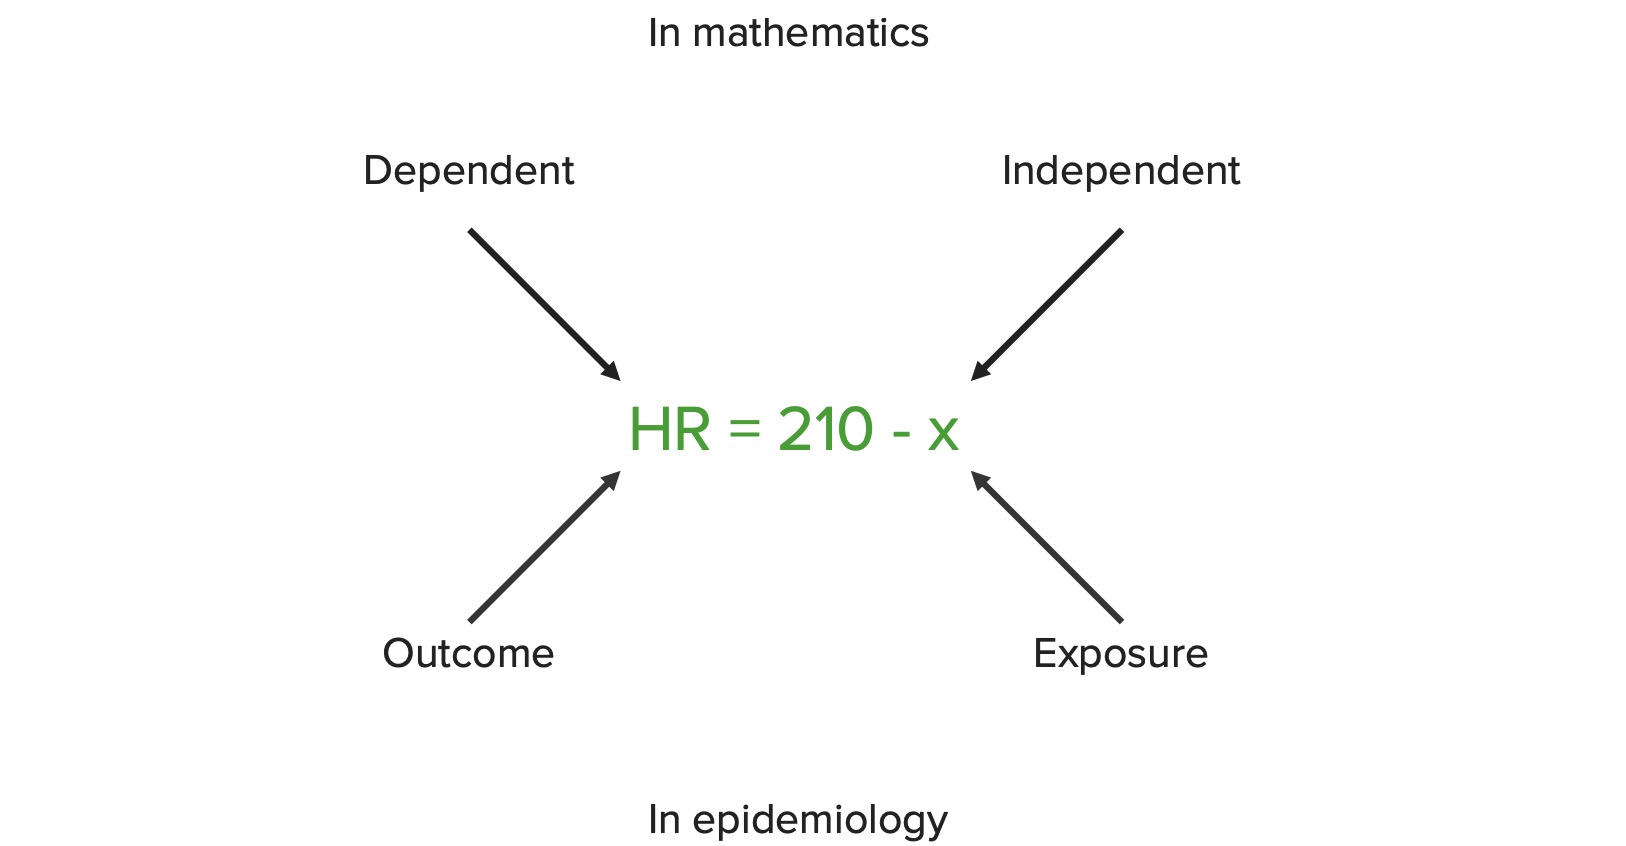
00:01 Hello and welcome to epidemiology. You know when a lot of people think about epidemiology, they tend to conflate it with statistics and in fact they think epidemiologists are sometimes statisticians and that's a mistake. We use statistics as a tool in what we do, but we're not statisticians. We do however like to understand what statistics is all about. Now I'm not a fan of statistics, I don't think I'm very good at it and yet I teach it, and I've got a PhD in biostatistics, that should tell you something, it should tell you that if you are not confident in this topic, it's okay, it's okay to stumble through it, you will be fine and because I'm fine with it as well, it's not that difficult. Today we're going to learn about the meaning of P-values and confidence intervals and the null hypothesis. 00:45 These are the foundation for what we call frequentist statistics. We're also going to learn about the differences between data and information and what makes data into information. 00:56 And we're going to learn about the differences between different types of variables, the kinds of variables that exist tell us what kind of statistical tests we want to apply. 01:07 So as I mentioned there is a close relationship between epidemiology and statistics, but they are not the same thing, statistics is a tool used by epidemiologists. What are these numbers, 53, 61 and 62, absent of any context, they mean nothing to you, you could perform math on them, you can compute their mean, their differences, you can add them all up and multiply it by something else, that doesn't give you any information. But if I tell you that these are the ages of Barack Obama, Angela Merkel and Vladimir Putin as of mid-2015, suddenly you have context, the numbers are data. When I add context to those numbers, they become information, it is the information that I care about. Suddenly if I took the average of these numbers, I get an average age of 3 leaders, it means something now. Otherwise their numbers on which I perform mathematical functions and I know nothing about the context anymore or what to conclude from that. So I'm trying to do a distinction here between mathematics, research, computer technology and other kinds of application of numbers. 02:18 When we talk about a variable, a variable is a place keeper for an idea and that idea we can perform mathematical functions on to learn more things about larger ideas. In mathematics, a variable is a value that may change within a problem or scope of a problem. In research a variable can be a logical set of attributes, like gender or age, where you live, what state you live in, where you're born, that sort of thing. In computers, a variable is a symbol given to an unknown quantity, as a register, a space to keep a number in, I can perform math on that as well. I could depict these ideas as symbols in math, X is the common place keeper for a variable, in research X might code for a patient's age or in computers, it could be a string, depending upon what computer language I'm using. So in mathematics we write a relationship between two variables as a function, for example, F(x) = 210 – x. 03:20 Now that tells me that every time I have a value of X, I subtract that from 210 and I get a value for F(x), I haven't got any context yet. On the other hand if I tell you that this is a function for measuring the directed maximum heart rate when you're working out, suddenly you have context. X is your age, 210 minus your age gives you the heart rate that you target during your workout, it has meeting now, it has context. In mathematics again, your heart rate is the dependent variable, the X is the independent variable. The X is free to be whatever it wants, but the heart rate depends on X, the age. In epidemiology we rename those constants, exposure and outcome. I don't mean constants, I mean variables. 04:07 So X, my age, is an exposure, the heart rate is the outcome, it's the same idea though. 04:13 I can consider this to be cancer rate and smoking rate, that has perhaps a bit more meaning in an epidemiological public health context. So the smoking rate is the exposure, the cancer rate is the outcome.
About the Lecture
The lecture Epidemiology and Statistics by Raywat Deonandan, PhD is from the course Statistics: Basics.
Included Quiz Questions
Which of the following is essential for converting data into information?
- Context
- Mathematics
- Research
- Computers
- Epidemiology
Which of the following is the INDEPENDENT variable in the following research question? What is the rate of lung cancer in 40-year-old males who smoke versus 40-year-old non-smokers, over a ten-year period?
- Smoking
- Lung cancer
- 40-year-olds
- Males
- Skin cancer
Author of lecture Epidemiology and Statistics

Raywat Deonandan, PhD
Customer reviews
5,0 of 5 stars
| 5 Stars |
|
1 |
| 4 Stars |
|
0 |
| 3 Stars |
|
0 |
| 2 Stars |
|
0 |
| 1 Star |
|
0 |
Awesome Awesome Awesome Awesome Awesome Awesome Awesome Awesome Awesome Awesome Awesome Awesome Awesome Awesome Awesome Awesome Awesome Awesome Awesome
