Playlist
Show Playlist
Hide Playlist
Cardiovascular Response and CO Changes in Endurance Training – CV Response to Exercise

-
Slides CVresponse VascularPhysiology.pdf
-
Download Lecture Overview
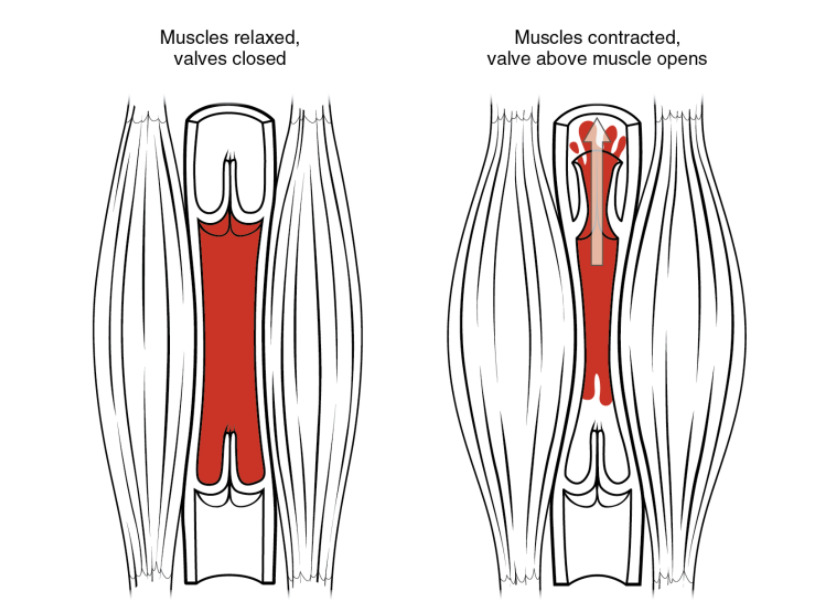
00:00 Now let's switch gears and talk about endurance exercise because you don't just do anaerobic exercise, you don't just do isotonic exercise but you do aerobic exercise which may involve walking or running or cross-country skiing. Here you have an increase in total body oxygen consumption, there are increases in cardiac output which involve both increases in heart rate and stroke volume. There are large redistributions of organ blood flow to the working muscle. 00:36 There are also increases in mean arterial pressure, although it's primarily systolic blood pressure because there is little to no change in diastolic. So let's go through these one by one and tease out why we're getting the effects that we are. This is a nice diagram to look at changes in heart rate in response to resting conditions, to aerobic workload such as walking or running and then maximal. You can see there's a nice linear relationship between heart rate and workload, meaning the harder you work the higher your heart rate. Now stroke volume is similar to a point. During resting conditions all the way up to moderate work, you have a linear increase in stroke volume but as you get towards maximal exercise it flattens out some and the reason why there are probably two, one is heart rate is so high during maximal conditions that the blood does not have enough time to fully fill the heart before it contracts again. So you have a limitation in your ability to increase stroke volume. It goes up to a point and then levels off. There is a blood flow redistribution that occurs and this blood flow involves everything from the heart to the skin, to the GI tract and all of these will change at different levels of work. If we want to start with the gastrointestinal system, it usually decreases during exercise. So this can be seen in the blue line here where you go from rest to light exercise to moderate exercise to maximal. There is a dramatic decrease in blood flow. If you want to contrast that to something like the heart, you can see in the green line there's a progressive increase in blood flow as you increase work intensity. Other items such as the skin which is denoted here in the red triangles, there's an increase in blood flow to a point to moderate exercise. Once you get to heavy exercise, it decreases. The reason for this is likely having to do with thermal regulation. Your body tries to maintain internal temperature but eventually it will rather have blood pressure than internal temperature so often decreases during maximal exercise. The open circles with the dots, that's brain blood flow and you can see there that brain blood flow really doesn't change across any of the exercise conditions. Your brain gets blood flow whether you are at rest or maximal exercise. The other graph that you see there is plotting blood flow and exercise intensity again and that is very specific to the muscle vasculature. As you can see probably the biggest rise in the amount of blood flow that you can get is in the muscle. So skeletal muscle will increase with light exercise, moderate exercise and maximal exercise. In fact the maximal exercise blood flows can be quite quite high.
About the Lecture
The lecture Cardiovascular Response and CO Changes in Endurance Training – CV Response to Exercise by Thad Wilson, PhD is from the course Vascular Physiology.
Included Quiz Questions
Which of the below responses is most likely when one goes from moderate to maximal aerobic exercise intensity?
- An increase in cardiac muscle blood flow
- An increase in skin blood flow
- An increase in cerebral blood flow
- An increase in gastrointestinal blood flow
- A decrease in skeletal muscle blood flow
Which of the following organs does NOT have a change in blood flow with increasing aerobic exercise intensity?
- Brain
- Gastrointestinal system
- Lungs
- Skin
- Heart
Author of lecture Cardiovascular Response and CO Changes in Endurance Training – CV Response to Exercise

Thad Wilson, PhD
Customer reviews
5,0 of 5 stars
| 5 Stars |
|
5 |
| 4 Stars |
|
0 |
| 3 Stars |
|
0 |
| 2 Stars |
|
0 |
| 1 Star |
|
0 |
