Playlist
Show Playlist
Hide Playlist
Carbon Dioxide Transport – Gas Transport

-
Slides Gas Transport.pdf
-
Download Lecture Overview
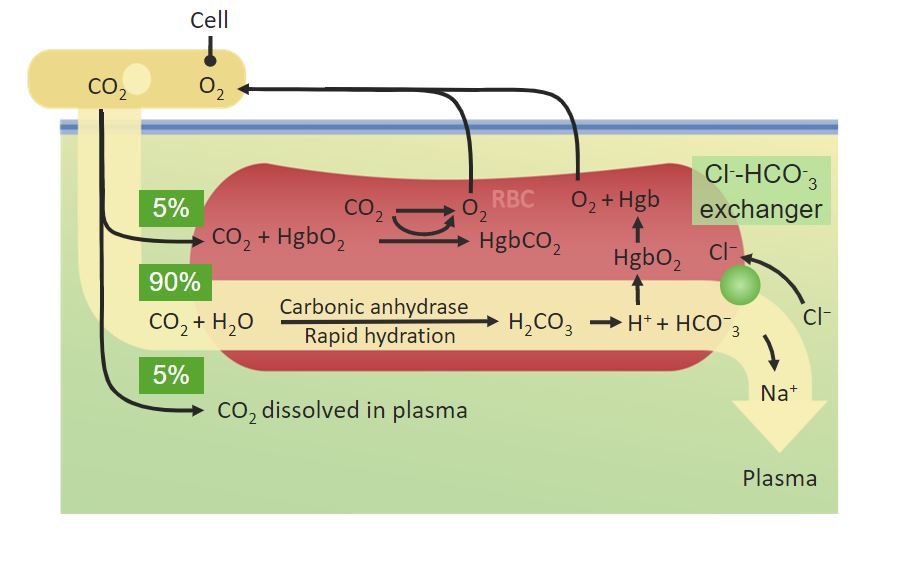
00:01 We start off with a partial pressure of CO2. 00:05 So just like O2, we have three partial pressures to keep in mind. 00:10 One is PaCO2, PACO2 and PvCO2. 00:17 Again, the small A is denoted to be arterial side of the circulation. 00:21 The capital A is for alveolar carbon dioxide concentration. 00:25 And the V is for the venous side of carbon dioxide. 00:28 What are typical numbers? Usually, you’ll start off with a PaCO2 of around 40, A PACO2 of around 40, and a PvCO2 of around 46. 00:45 So you can notice that in this case, the PaCO2 is less than the PvCO2. 00:52 And that should make you think that you’re giving up carbon dioxide by the peripheral tissue. 01:01 Now, this is what this particular number of a PaCO2. 01:09 You might think, “Well, what exactly does this mean in terms of how it is carried?” And if we think about that, the first one is that it involves this carbonic anhydrase reaction that we’ve discussed earlier where carbon dioxide combined to water form carbonic acid and then dissociate into a bicarb ion and a hydrogen ion. 01:31 However, for this to really work, you need to have a red blood cell. 01:35 And I’ll explain that in the next couple slides. 01:38 CO2 is also bound to hemoglobin, but this is related to the amount of oxygen that’s already bound to hemoglobin. 01:47 So hemoglobin has a higher affinity for O2 and the CO2 binding site is in a different part of the molecule. 01:57 And so it’s going to have a different binding affinity based upon the amount of oxygen that’s bound. 02:04 The final thing about CO2 is it has a higher solubility coefficient and therefore more of it will be dissolved in the plasma than O2. 02:14 So let’s look at this a diagrammatic form. 02:17 If you look on the left side of the diagram, you can see that you have here a cell in which it’s going to allow for carbon dioxide to move out of it. 02:31 In this case, a small percent, about 5% is going to be dissolved in the plasma. 02:37 The rest of the CO2 transports within to the red blood cell. 02:42 It undergoes that carbonic anhydrase reaction, forms bicarb and then bicarb is kicked out of the red blood cell in something called a chloride shift. 02:54 And that chloride shift is done via a chloride bicarb exchanger. 02:59 And this particular transporter allows for an electrogenic, meaning that there is not a charge change across the membrane to allow chloride to come in versus bicarb to leave. 03:14 Some of the carbon dioxide ends up being bound to hemoglobin. 03:21 As it is bound to hemoglobin, what it does is forms this relationship in terms of about 5% of the carbon dioxide is bound in that form. 03:34 If we look at this in a total kind of picture, we see that some of the carbon dioxide is in the dissolved form, about 5%. 03:44 About 5% is bound to hemoglobin and the rest, the 90%, is in the form of bicarb. 03:54 Similar to O2, carbon dioxide also forms a relationship with hemogblobin. 03:59 This allows us to form a carbon dioxide to hemoglobin dissociation curve. 04:05 There are a few things, however, about these two curves that are different. 04:08 So let’s go through each one of those one by one. 04:11 The first portion that is different is that you’re going to be travelling from the venous side of the circulation, has a higher CO2 than the arterial side of the circulation. 04:22 So in terms of the curve, you’re moving from a higher level to a lower level. 04:28 The other thing that’s different is that the amount of O2 dramatically affects its binding capabilities. 04:35 And so as O2 decreases, you can bind more and more CO2. 04:41 This is important in aspects of thinking about if you’re in a hypoxic condition, you could actually carry more CO2 in the bound form to hemogblobin. 04:53 The last couple item are just general observations between an O2 hemoglobin dissociation curve and a CO2 hemoglobin dissociation curve. 05:04 And the first thing to think about is instead of a sigmoidal shape that occurs with the O2 dissociation curve, the CO2 dissociation curve is a more linear. 05:15 The other aspect to think about is the CO2 content is about double that what occurs with O2 content. 05:25 So you can see on the arterial side of the circulation, you have nearly 40 milliliters of CO2 per 100 mLs of blood or per deciliter of blood while on the O2 side, you may have only had about 20 milliliters of O2.
About the Lecture
The lecture Carbon Dioxide Transport – Gas Transport by Thad Wilson, PhD is from the course Respiratory Physiology.
Included Quiz Questions
Which of the following are the normal values for PaCO2, PACO2, and PvCO2 respectively?
- 40 mmHg, 40 mmHg, 46 mmHg
- 100 mmHg, 95 mmHg, 40 mmHg
- 90 mmHg, 40 mmHg, 46 mmHg
- 46 mmHg, 40 mmHg, 40 mmHg
- 40 mmHg, 95 mmHg, 100 mmHg
Which of the following ions is bicarbonate exchanged for in a red blood cell?
- Chloride.
- Potassium.
- Sodium.
- Calcium.
- Hydrogen.
Which of the following is correct when comparing the CO2-hemoglobin dissociation curve to the O2-hemoglobin dissociation curves?
- The CO2 content is about double the O2 content.
- They both have higher partial pressures on the arterial side than the venous side.
- The Haldane effect is exhibited on the O2 curve but not the CO2 curve
- They are both sigmoidal in shape
- Neither molecule affects the other molecule's curve.
Author of lecture Carbon Dioxide Transport – Gas Transport

Thad Wilson, PhD
Customer reviews
5,0 of 5 stars
| 5 Stars |
|
1 |
| 4 Stars |
|
0 |
| 3 Stars |
|
0 |
| 2 Stars |
|
0 |
| 1 Star |
|
0 |
like it very much thanks Thad you are very good
