Playlist
Show Playlist
Hide Playlist
Vascular Function Curves – Regulation of Venous Pressure

-
Slides RegulationVenousPressure VascularPhysiology.pdf
-
Download Lecture Overview
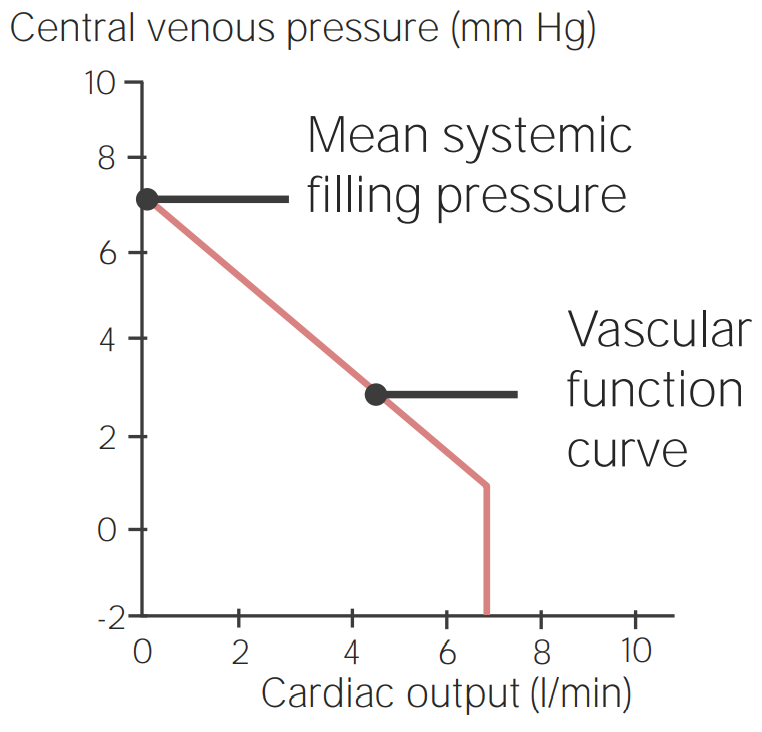
00:00 To look at venous function curves or vascular function curves, they are sometimes referred to, we need to construct what they look like. So the veins are going to be what, from the venules to the veins to the large veins, this process involves getting blood back to the heart. It's more important to think about the speed at which you're getting blood back to the heart from the venous perspective because of the high capacitance veins have. Arteries don't have high capacitance so they pretty much act as rigid tubes and move fluid towards the tissue and then the veins. The veins have high capacitance which mean they can stretch so they can hold a lot of that fluid. So how do you construct this kind of curve? A vascular function curve is usually plotted with cardiac output on the X axis and center venous pressure on the Y. We have a couple of variables to go ahead and talk through. One is something called mean systemic filling pressure. What mean systemic filling pressure is? Is the pressure within the cardiovascular system if you shut the pump off. So there is no pumping action undergoing. At that point, you still have pressure within the system because there's still blood volume within the system. 01:32 The other portion of a vascular function curve is there is a flat edge to the part that comes in to cardiac output. The reason why that happens is because veins can collapse. Veins don't just stay open, when you don't have pressure in them they will collapse. That's a distinct function of veins that doesn't happen with arteries who have enough structural integrity with things like collagen as well as vascularity and muscle that keep them open. So when we look at alterations in these vascular function curves, let's start with a normal curve and then let's add some things to it. The first thing we can do is we could add blood volume to this system. 02:20 So if we add blood volume to a vascular function curve, it offsets it above, meaning that now you have a higher mean systemic filling pressure to start and you're going to have a higher cardiac output. All along the way at any given cardiac output you will have a higher central venous pressure. The opposite is also true. If you have a decrease in blood volume which could occur through something like a hemorrhage or you have a lost of fluid you can have a decrease in mean systemic filling pressure, a decrease in cardiac output and that offsets that whole curve, meaning that for any given cardiac output you have a lower central venous pressure. 03:12 Besides blood volume, you can also change systemic vascular resistance. If you have an increase in SVR, this acts to steepen the slope. You do not change, however, mean systemic filling pressure, only the cardiac output. So at this case at any given cardiac output, you have a lower central venous pressure but the relationship you have is not identical to what you'd have if you had a decrease in blood volume. The opposite is also true if you have a reduced systemic vascular resistance, you will have the same mean systemic filling pressure but an elevated cardiac output and that is because there is less afterload and therefore you can move more fluid through the system that ends up in the veins.
About the Lecture
The lecture Vascular Function Curves – Regulation of Venous Pressure by Thad Wilson, PhD is from the course Vascular Physiology.
Included Quiz Questions
Based on vascular function curves, if a condition increased both mean systemic filling pressure and cardiac output, which of the below conditions would most likely occur?
- Increased blood volume
- Decreased blood volume
- Increased systemic vascular resistance
- Decreased systemic vascular resistance
- Decrease in heart rate and stroke volume
Which of the following vessels will collapse if the blood volume decreases?
- Veins
- Arteries
- Capillaries
- Arterioles
- Coronary arteries
Author of lecture Vascular Function Curves – Regulation of Venous Pressure

Thad Wilson, PhD
Customer reviews
5,0 of 5 stars
| 5 Stars |
|
1 |
| 4 Stars |
|
0 |
| 3 Stars |
|
0 |
| 2 Stars |
|
0 |
| 1 Star |
|
0 |
Nice video, succinct, and clear. Cleared some concepts up like why the mean systemic pressure changes or does not change.
