Playlist
Show Playlist
Hide Playlist
Frank-Starling Curve and Atrial Dynamics – Cardiac Mechanics

-
Slides Physiology-Cardiac-Mechanics.pdf
-
Download Lecture Overview
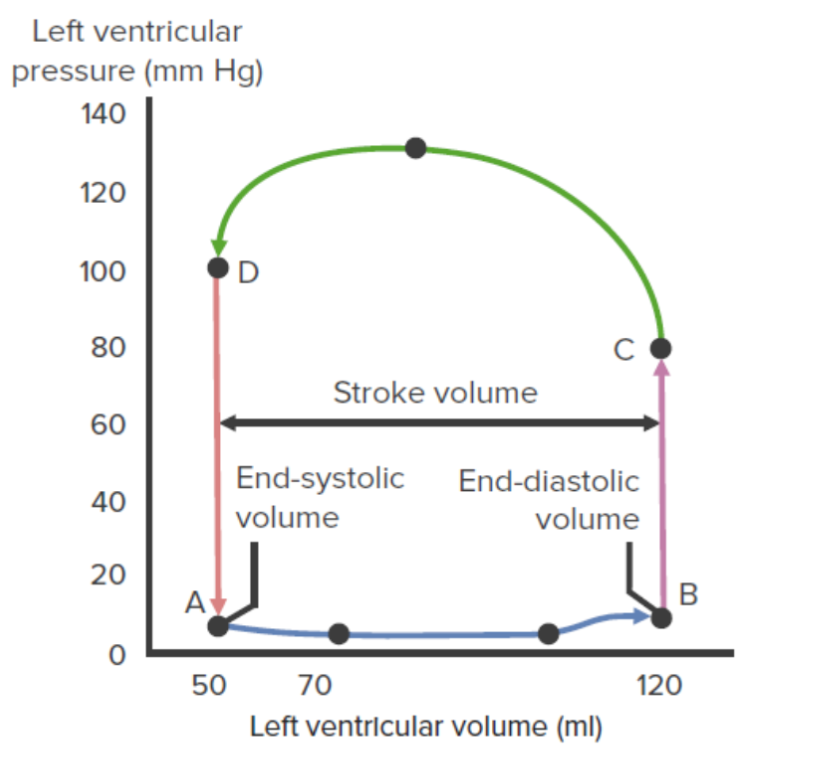
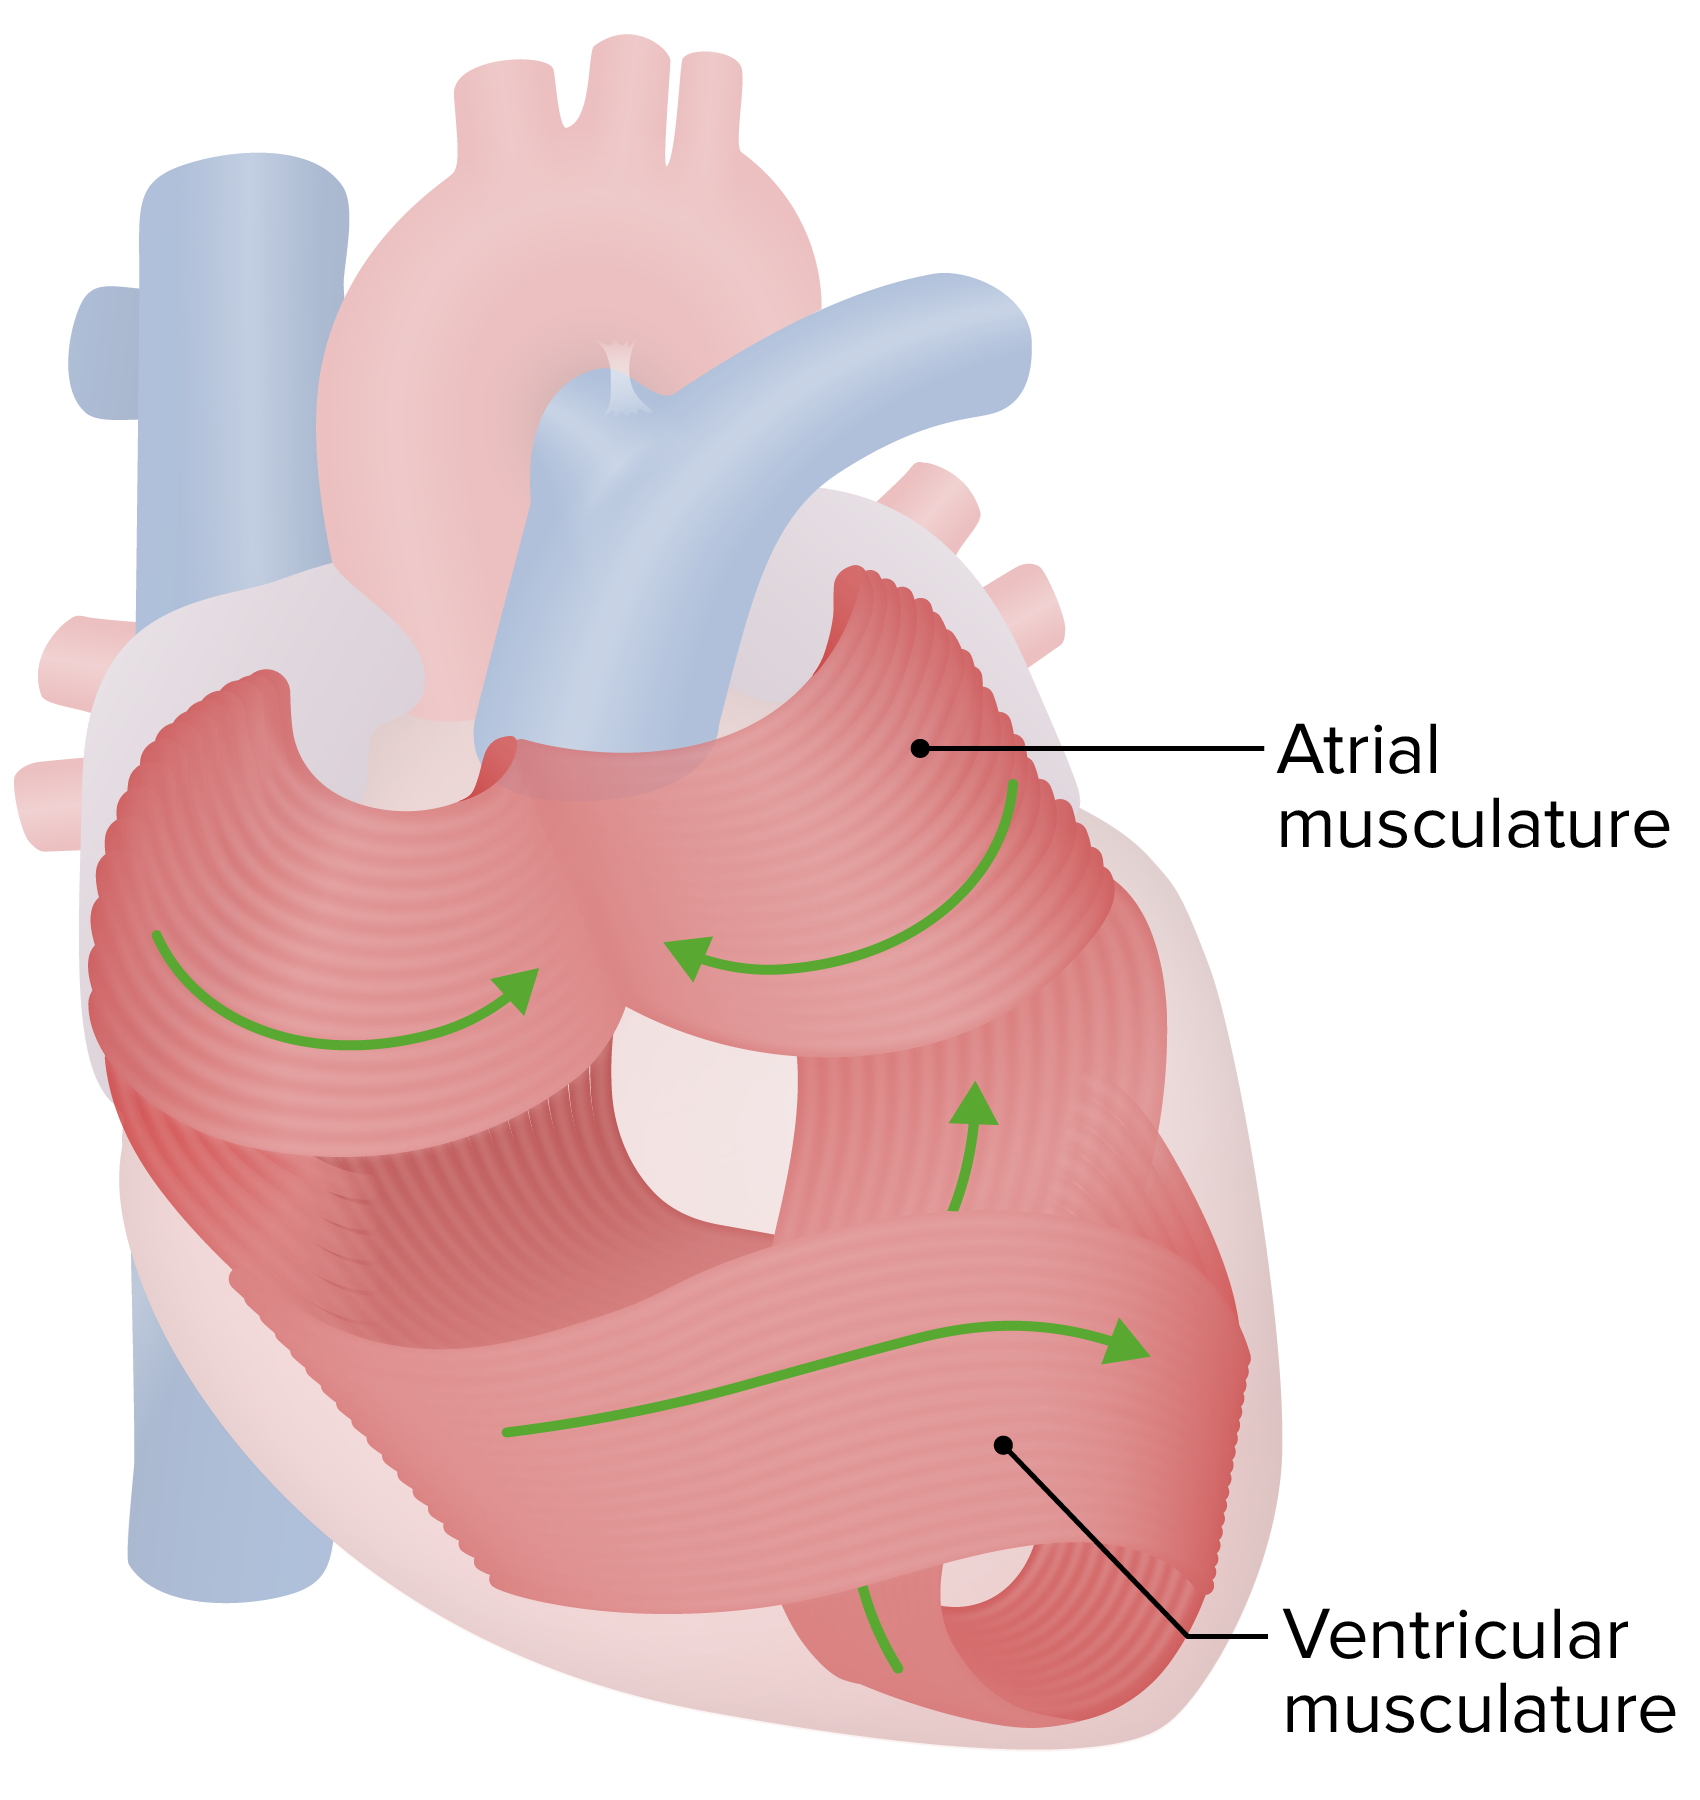
00:01 Let's summarize a number of the changes that happen on the Frank-Starling curve. 00:07 This will allow us to bring concepts together because we know they’re hard. 00:12 But if we review them again, we’ll be able to gain better insight into them. 00:16 And as you see them change in close proximity, you’ll be able to comprehend all the different changes that happen because, remember, nothing ever changes in isolation. 00:27 So, let's go through those. 00:29 And increase in preload, you travel along the same curve, but just two upward points. 00:37 A decrease preload, use the same curve again. 00:41 But now, you're going down in the curve, which means you're at a lower left ventricular end-diastolic pressure. 00:50 If you have an increase in inotropy or a decrease in afterload, you shift the whole curve to the left and upwards a little bit. 01:00 That means per amount of left ventricular end-diastolic pressure you’re going to get a greater stroke volume. 01:09 If you have an increase in afterload or a decrease in inotropy you get a shift in which the curve moves downward and to the right. 01:18 This means that at any given left ventricular end-diastolic pressure you’re going to have a lower stroke volume. 01:26 Now, let's really dive in to these interrelationships because there are certain times that the body is going to change multiple things at the same time. 01:38 So, let's take a good example that is a fight or flight response. 01:42 This is something where your body is going to have to respond to something and runaway. 01:47 To be able to do that, you're going to have to increase your cardiac output. 01:51 So how are you going to do it? Well, there are a couple of mechanisms that you can start with. 01:56 The first mechanism that you’re going to go through here is you're going to increase the left ventricular end-diastolic volume. 02:06 You're also then going to increase the end-systolic pressure-volume relationship. 02:12 So, both of these effects are going to occur almost at the same time. 02:18 Now the change in left ventricular end-systolic pressure-volume relationship, that is a change in inotropy. 02:25 The change in the increase in left ventricular end-diastolic volume, that is a change in preload. 02:31 So, that is our inotropic change and our preload change. 02:37 Interestingly, what that allows then to happen is for greater stroke volume than would've occurred with either one of them independently. 02:47 So, this sympathetic stimulation utilizes multiple mechanisms /to make that curve as wide as possible and that wide curve gives you a bigger stroke volume. 02:59 If you have a large stroke volume, then all you need to do is beat more frequently and you’ll have a higher cardiac output. 03:07 The top part of the heart also responds to a number of changes in preload, in afterload, in inotropy. 03:16 And these changes will occur and help to facilitate the amount of venous return, or sometimes, we’ll just refer to that as preload. 03:27 If you have an increase in venous return, you will have a greater contraction of the left and right atria. 03:34 That should fill the left ventricles to a greater degree. 03:40 However, if you have too much flow in those areas, you can lead to things like regurgitation of the valve; and sometimes if there are stenotic valves, you can also get some buildup of fluid within the ventricles. 03:56 A lot of stimulation with nerves also affect the atrium's ability to contract. 04:02 There, a sympathetic nervous stimulation will give an increase force of contraction, and vagal stimulation typically allows for greater amount of failing to occur, but does not change ionotropy.
About the Lecture
The lecture Frank-Starling Curve and Atrial Dynamics – Cardiac Mechanics by Thad Wilson, PhD is from the course Cardiac Physiology.
Included Quiz Questions
Which of the following cardiac changes will increase stroke volume?
- Increased preload
- Increased afterload
- Decreased inotropy
- Decreased cardiac contractility
- Increased end-systolic volume
Which of the following physiological conditions causes a greater atrial contraction?
- An increase in venous return
- A decrease in sympathetic nervous system stimulation
- An increase in parasympathetic nervous system stimulation
- An increase in premature ventricular contractions
- Atrial fibrillation
Author of lecture Frank-Starling Curve and Atrial Dynamics – Cardiac Mechanics

Thad Wilson, PhD
Customer reviews
5,0 of 5 stars
| 5 Stars |
|
1 |
| 4 Stars |
|
0 |
| 3 Stars |
|
0 |
| 2 Stars |
|
0 |
| 1 Star |
|
0 |
I enjoyed the breakdown of each intricate part of the system. I feel that I understand pharmacology better, especially digoxin and its effect on the heart.
