Playlist
Show Playlist
Hide Playlist
ECG Tracing: Normal Intervals – Electrocardiogram

-
Slides CV Physiology-Electrocardiogram.pdf
-
Download Lecture Overview
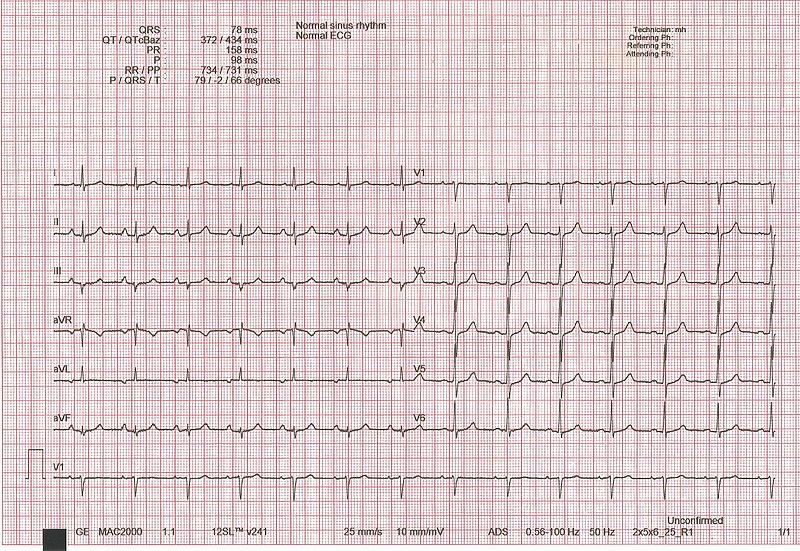
00:01 So, now, let’s put some numbers to these. 00:04 So, you could actually measure someone's P wave, their PR interval, their QRS complex, and even their QT interval and know what's normal. 00:13 Because if you know what's normal, then you can see what pathology might occur if they’re outside these normal ranges. 00:22 The P wave needs to be somewhere between about 0.08 to 0.1 second. 00:29 The PR interval, this is very important, needs to be between 0.12 and 0.2 seconds. 00:37 The QRS complex, we went through earlier, 0.06 to 0.1 second. 00:42 And finally, the QT interval is a little bit more varied. 00:46 The QT interval is very dependent upon someone's heart rate. 00:52 So, you measure your R-R interval and that's part of the equation to calculate what's normal for a QT interval. 01:02 So, the QT interval is usually less than 0.44 seconds, but it's dependent on heart rate. 01:08 And so, with a really high heart rate, you have to adjust that number. 01:12 A very low heart rate, you have to adjust that number. 01:15 QT intervals are very important for a disease known as sudden cardiac death, in which a person can die, and if you have a prolonged or long QT interval, it is a set up or potentially part of that pathology Okay, so we have the three standard limb leads, 1, 2 and 3. 01:37 Standard limb lead 1 is taking a picture across the heart n this direction. 01:43 So, for taking a picture across, we know we have to have two poles. 01:47 In the right side, we’re going to have a negative pole and the left side we’re going to have a positive pole. 01:54 This picture then is taken in this direction. 01:57 Standard limb lead 2 goes from a negative pole on this side to a positive pole down here. 02:06 And that takes a picture across the heart. 02:10 And then finally, we have standard limb lead 3, which has a negative pole up top and then a positive pole down here at the bottom, taking a picture this way across the heart. 02:21 Having multiple ways to view the heart gives you all the pictures in this angle. 02:27 Now, besides those, we have some supplemental leads across those particular planes, and these are called augmented leads. 02:38 Little bit harder to think about. 02:40 We have aVL, aVF, and aVR. 02:45 They have a negative pole in the central terminal, which is a mathematical denotation of where the negative pole is. 02:53 The positive pole is wherever you have the travel to. 02:59 So, aVL will be here, aVR here, aVF down here. 03:06 All traveling from a negative central pole. 03:10 Gives you three more views of the heart. 03:13 So, if we look at this plane here, we’re getting six different pictures across the various leads. 03:23 This is very handy because we might have pathology in one or two of the leads and not in the others because we have the right picture for the right pathology. 03:33 Okay. 03:34 You also have a few other leads that are located along the chest. 03:39 And these chest leads take a picture through the chest. 03:44 So, now, you're going from the surface of the skin into the heart and those pictures are done with V1 through V6. 03:55 And how these are set up is you have to count intercostal spaces. 03:59 So, I'm sure you can do this at home. 04:01 While you're watching right now, I want you to feel for the spaces n between your ribs. 04:06 If you feel for the first space, count down four spaces and that's where you put the electrode one on the right side. 04:15 Then you have the V2, fourth intercostal space down on the left side. 04:21 Then you go midclavicular, so you take your clavicle, split it in half, you drop down to the fifth intercostal space, and that's where you put V4. 04:32 V3, you put in the midpoint between two and four. 04:36 Then you keep going along the intercostal space, number five, all the way to the axilla and that's where you get V5 and V6. 04:44 So, you have to count your intercostal spaces. 04:47 Don't giggle. 04:48 Don't giggle. 04:49 Don't tickle yourself. 04:50 Just make sure you count those intercostal spaces. 04:57 Now that you have these various views of the heart, let's look at an example. 05:04 So, this is looking at the standard limb lead 1, 2 and 3. 05:09 This is the very same heartbeat. 05:13 Let me say that again. 05:14 This is the very same heartbeat, looking at it from three different angles. 05:21 You see in standard limb lead 1, you see a P wave, but the QRS complex is lower. 05:27 So, you really only see the R wave. 05:30 In standard limb lead 2, you see the P wave and you see an exaggerator, a really tall R wave. 05:37 In standard limb lead 3, you see the P wave and you see a moderate R wave. 05:43 This is all the very same heartbeat. 05:47 Just looking at it from three different angles because you have three different setups of where the positive and where the negative electrode are. 05:58 So, in the first one, you're taking a picture across the heart here, along this line. 06:04 The second one, you're taking it down across the chest. 06:07 And then the third one, you're taking it from here down. 06:11 So, three different pictures, give you three different R wave amplitudes than the same beat. 06:19 You might ask, why you do that? Because, again, different pathologies show up more often in different leads. 06:27 So, you have to know what a normal lead would look like in these three standard limb leads. 06:33 Let’s look at some of the other leads because they too can tell you about where the different pathologies or mean electrical axis might lie. 06:43 This is the normal tracing that's going to happen through your augmented leads and these are the ones that have the central terminal of negative. 06:52 And you have the positives out on one of the sides of the shoulders or down at your foot. 06:58 So, if you look at aVR, you can see that the P wave is negative, you see an exaggerated S wave and you see the T is inverted. 07:09 aVL, you can see a small P wave, you can see an upward and downward deflection of the QRS complex and a T wave. 07:20 And aVF, you see a P wave, you see a very tall R wave, a little teeny S wave, and then a T wave. 07:29 These are all the same heartbeat. 07:31 That is the same heartbeat if you look at it in three different ways. 07:36 That is why it's important to have a good feel of which electrode you're looking at, so that you know what's normal. 07:43 Because if all you saw was an aVR there, you’d would say, wow, it looks like we just flipped our electrodes around or you might think maybe the heart always generates just a negative deflection on the ECG. 07:55 And that would not be correct. 07:57 You have to know where you're at to know which electrode to look at, so that you can understand what the ECG is telling you.
About the Lecture
The lecture ECG Tracing: Normal Intervals – Electrocardiogram by Thad Wilson, PhD is from the course Cardiac Physiology.
Included Quiz Questions
What is the length of a normal PR interval?
- 0.12 to 0.2 seconds
- 0.08 to 0.2 seconds
- 0.06 to 0.1 seconds
- 0.08 to 0.1 seconds
- 0.06 to 0.3 seconds
Where is the unipolar chest lead V4 placed?
- 5th intercostal space at the left midclavicular line
- 2nd intercostal space left of the sternum
- 3rd intercostal space right of the sternum
- 4th intercostal space at the right midclavicular line
- 6th intercostal space at the left midaxillary line
Which of the following ECG findings is typically associated with the unipolar limb lead AVR?
- Negative P wave
- Tall R wave
- Small P wave
- The QRS complex is always upright.
- Small S wave
Which of the following influences the corrected QT (QTc)?
- Heart rate
- Blood pressure
- Respiratory rate
- Mean arterial pressure
- Blood oxygenation
Author of lecture ECG Tracing: Normal Intervals – Electrocardiogram

Thad Wilson, PhD
Customer reviews
4,5 of 5 stars
| 5 Stars |
|
1 |
| 4 Stars |
|
1 |
| 3 Stars |
|
0 |
| 2 Stars |
|
0 |
| 1 Star |
|
0 |
i recomend the video to medical student, nurses and physician to learn
Generally good lecture but there are tons of typos everywhere on the slides for cardiac physiology and I'm pretty sure he misspeaks occasionally. Make sure you use another resource to fact check
