Playlist
Show Playlist
Hide Playlist
ECG Abnormalities – Electrocardiogram

-
Slides CV Physiology-Electrocardiogram.pdf
-
Download Lecture Overview
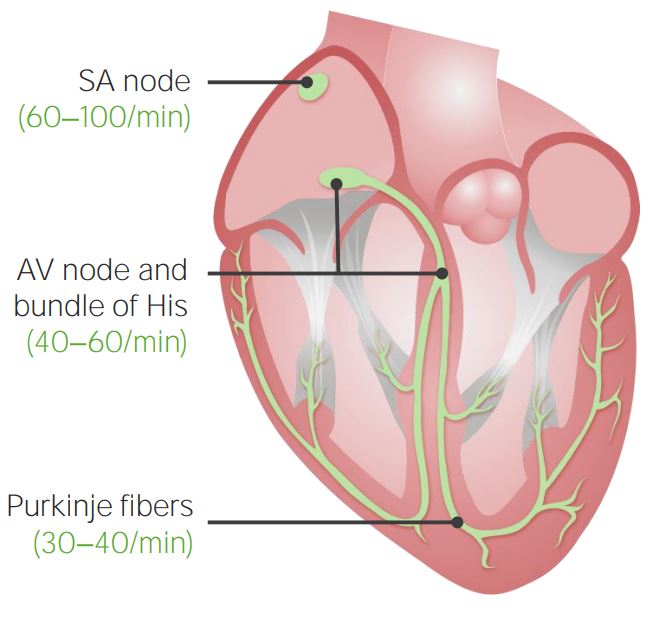
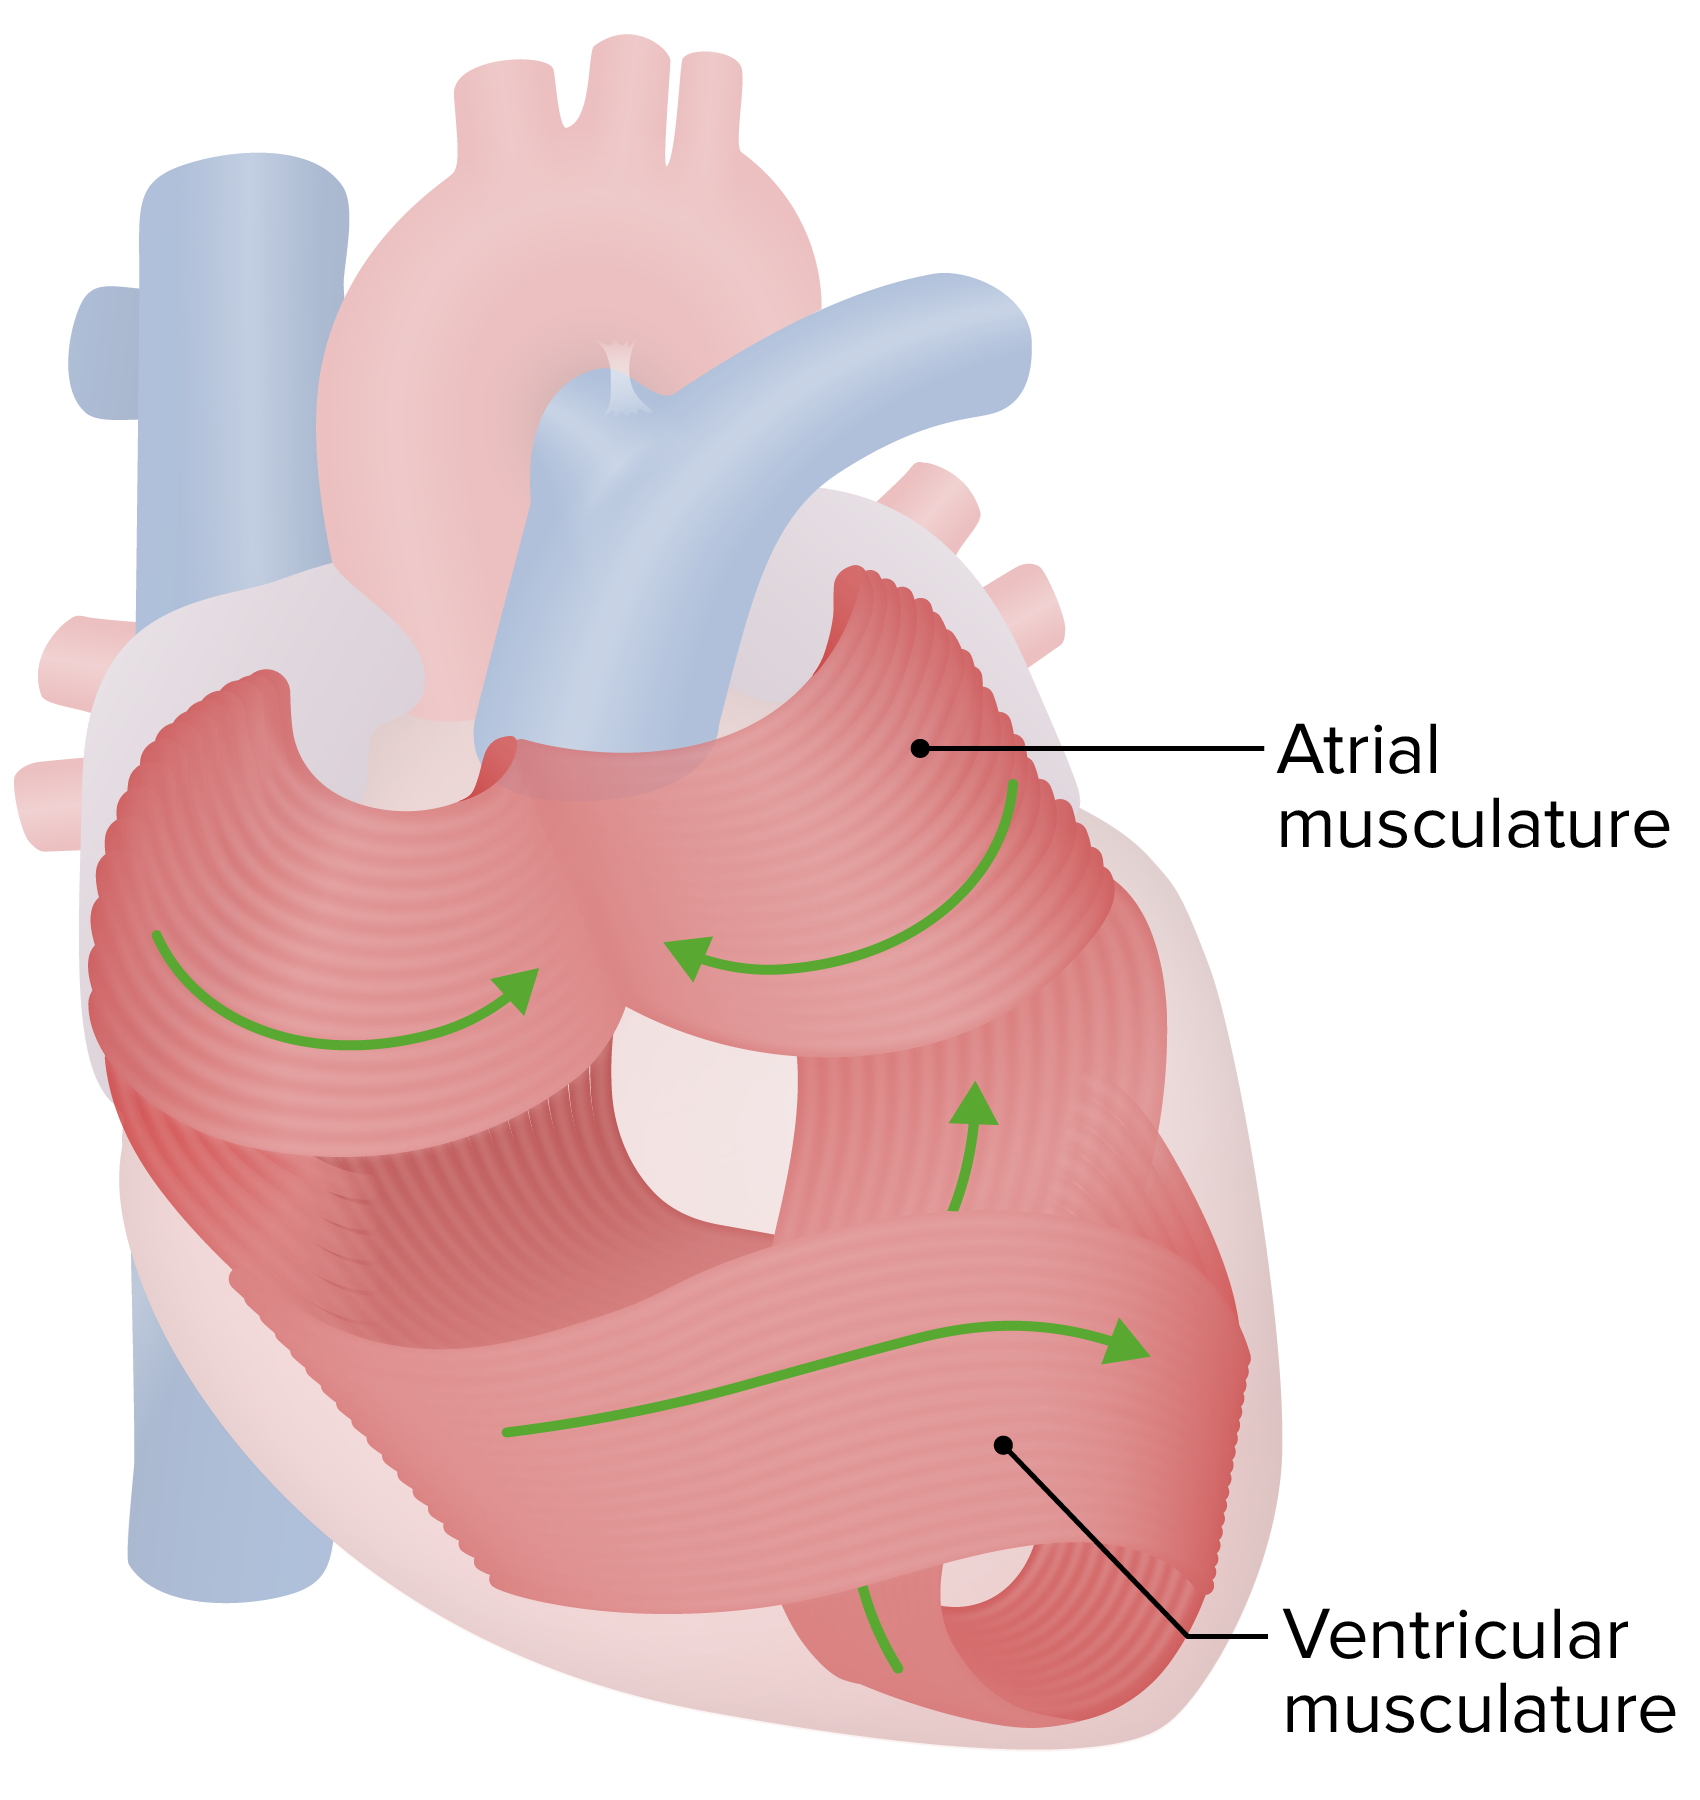
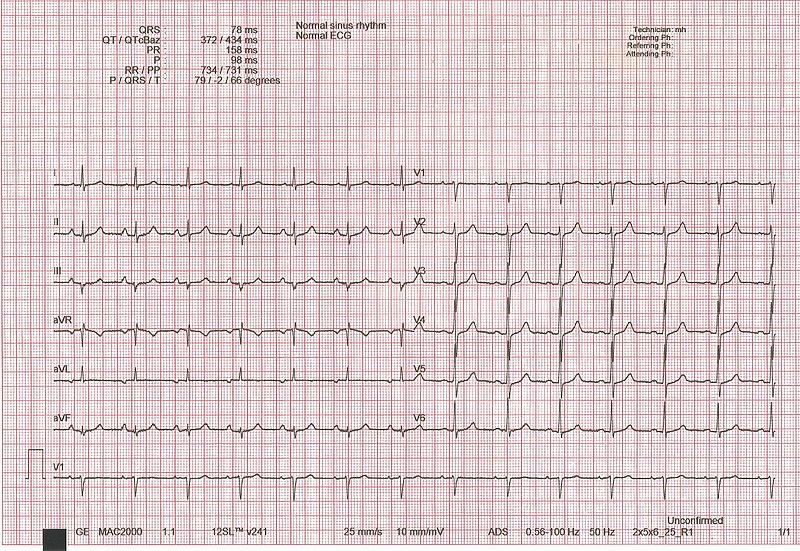
00:00 So now let´s get in to some of the pathologies. 00:03 You can see what a normal ECG wave looks like. 00:07 It has a normal P-wave, it has a normal QRS complex it has a T-wave. These are all important electrical properties of the heart. If someone has a disorder called atrial fibrillation the top portion of the heart is the atrium. 00:27 And these two atrium will show up as the P-wave. 00:32 Therefore, if you have atrial fibrillation, you should see abnormalities with the P wave and you can see that. 00:40 Usually, what happens is there's a lot of small jittery – what looks like noise in front of the QRS complex. 00:49 That is denoted as atrial fibrillation. 00:54 A first-degree AV block is a block and where you have a normal P wave, but it takes too long to capture a QRS complex. 01:04 And how do you know it's too long? It’s greater than 0.2 seconds. 01:09 That is a first-degree AV block. 01:12 A second-degree AV block is more serious than a first. 01:17 It means that there are certain times when you have a P wave and you don't capture a QRS complex. 01:25 Therefore, there is some block in the AV system that's preventing it from getting through. 01:32 A first-degree AV block is just slowing down. 01:37 The second-degree AV block involves some QRS complexes that are not captured from that P wave. 01:46 The most serious is a third-degree AV block and here you can see a number of P waves with no normal QRS complexes. 01:57 If there are QRS complexes that are generated, they are generated ectopically and therefore, have a wide QRS complex. 02:07 How do I know it's wide? It’s greater than 0.1 seconds. 02:11 That’s where all those intervals become important. 02:15 You have to be able to identify what the interval is and then know the normal numbers that are associated with it. 02:25 PVCs can be seen quite often. 02:27 These can happen if you have, again, a type III AV block, but you can also get PVCs to occur on a regular basis. 02:37 And here, you can see some PVCs that are occurring in a sequence. 02:41 And if you have them occur fast, that can be a ventricular tachycardia. 02:47 You notice that there is no isoelectric line. 02:50 You don't see any P waves. 02:52 All you have are these PVCs. 02:55 Even more serious than ventricular tachycardia is ventricular fibrillation. 03:01 So, at least in ventricular tachycardia, you are getting contractions of the ventricles that was pushing out blood. 03:09 In ventricular fibrillation, you have so many contractions happening, it's not pushing out enough blood per beat. 03:18 And if you don't push out enough blood, it doesn't circulate to the tissues. 03:22 And you end up having hypoxic tissues and actually could die in this condition, unless you got put on a defibrillator and you received shocks, and that is the best way to get out a ventricular fibrillation. 03:40 There are number of other ways to look at the ECG. 03:43 And as you move through medicine, you will just deepen your understanding of what an ECG is. 03:49 I'll go through one other pathology with you and this involves the STEMI myocardial infarction, which is a heart attack. 03:58 And I go through it just because it is something that you all have heard about are heart attacks and be able to understand or to recognize someone who had a heart attack with an ECG is helpful. 04:11 So, you can notice the normal QRS complex where you have a P wave, a Q, R and S, and then you have a T wave. 04:21 This can change if you're exposed to severe ischemia induced by lack of blood flow to certain areas of the heart. 04:30 What happens in ischemia is you have a decrease in membrane potential. 04:37 What do I mean by a decrease in membrane potential? It’s lower than normal. 04:42 So, if you have a lower-than-normal membrane potential, you start off on a lower level. 04:49 You have a normal P wave. 04:51 You might have a normal QRS complex. 04:54 But then you don't return back to this low level, which you had, because of this ischemic event. 05:03 And so, you end up being at a higher value for your ST segment. 05:08 And then you have a normal T wave. 05:10 This is called ST segment elevation. 05:15 And one of the key reasons why ST elevation happens is because of a little bit of a trick on your eye, which looks like the ST segment is elevated, when actually it's the normal isoelectric line that is before the P wave or after the T wave, which is suppressed, because of ischemia and lack of oxygen to a certain portion of the heart. 05:42 And so, this is just a very classic way to look at or to find out that someone has a heart attack if they show up with an ST segment elevation.
About the Lecture
The lecture ECG Abnormalities – Electrocardiogram by Thad Wilson, PhD is from the course Cardiac Physiology.
Included Quiz Questions
A patient's ECG shows a PR interval that is lengthened to 0.3 seconds throughout the tracing but still captures a normal QRS complex. Which of the following ECG abnormalities does this describe?
- 1st-degree AV block
- 3rd-degree AV block
- Atrial fibrillation
- Ventricular fibrillation
- Mobitz type I
Which of the following describes a random QRS > 0.1s seen in normal sinus rhythm?
- Premature Ventricular Complex
- Premature atrial complex
- Ventricular tachycardia
- Ventricular fibrillation
- Sinus arrhythmia
Which of the following changes are seen on an ECG when transmural ischemia is present?
- Normal P wave, ST-segment elevation, upright T wave
- Absent P wave, ST-segment elevation, upright T wave
- Normal P wave, ST-segment elevation, absent T wave
- Normal P wave, ST-segment depression, inverted T wave
- Notched P wave, Normal ST-segment, inverted T wave
Author of lecture ECG Abnormalities – Electrocardiogram

Thad Wilson, PhD
Customer reviews
5,0 of 5 stars
| 5 Stars |
|
5 |
| 4 Stars |
|
0 |
| 3 Stars |
|
0 |
| 2 Stars |
|
0 |
| 1 Star |
|
0 |
