Playlist
Show Playlist
Hide Playlist
Review of Normal ECG

-
Slides ECG of Myocardial Infarction.pdf
-
Reference List Electrocardiogram (ECG) Interpretation.pdf
-
Download Lecture Overview
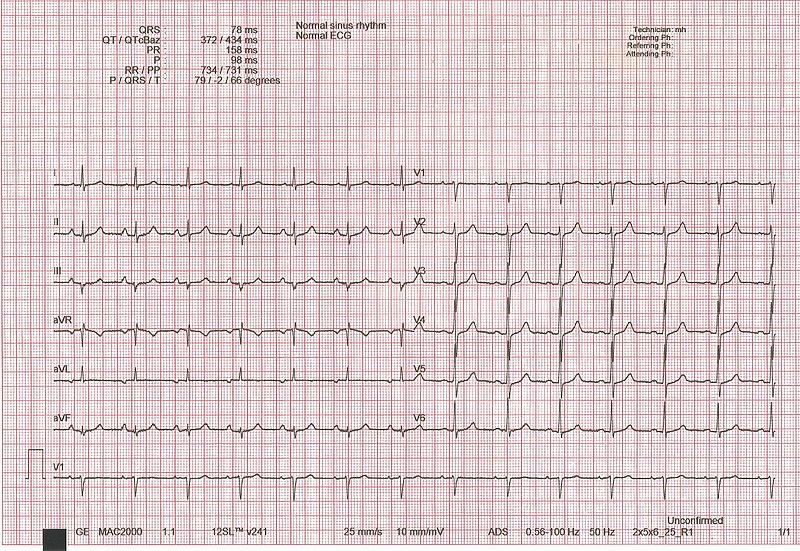
00:01 Hello, I'm Joseph Alpert. 00:03 And in this talk, we are going to go over the EKG changes that occur with myocardial infarction. 00:10 This is one of the most important uses for the electrocardiogram. 00:13 Early recognition of myocardial infarction enables effective therapy for example; reopening a blocked coronary artery to occur which markedly improves the survivability of the patient. 00:26 So again, let's just have a little review. 00:29 Remember that the electrocardiogram shows the electrical depolarization of the heart. 00:35 It's a simple, cheap, easy task often done in offices and hospitals everywhere. 00:40 It's almost always the first cardiac test that's done. 00:44 It's accurate for ischemia and acute myocardial infarction; that is a heart attack. 00:49 It's also quite accurate on ventricular hypertrophy; that is enlargement of the ventricle muscle and also for arrhythmias. 00:57 And remember, there are many nonspecific and non-diagnostic patterns which is why one has to practice a lot to recognize when something on the electrocardiogram doesn't mean anything. 01:07 An acute myocardial infarction is a heart attack. 01:10 It causes changes on the electrocardiogram in the T waves, in the ST segment and with the development of Q waves. 01:19 Q waves that were not present in the normal ECG that developed during a myocardial infarct represent literally holes in the heart. 01:27 That is electrical holes where there's no viable myocardial cells left. Remember this diagram? This is the normal electrocardiographic complex. 01:38 Notice in yellow, the P wave, usually three little boxes are less in duration and then a - then a short segment between the P wave and the QRS. 01:47 The entire yellow and orange section is referred to as the PR segment on the electrocardiogram. 01:53 In gray, the QRS complex; that's ventricular depolarization. 01:58 Then we have an ST segment that's usually flat, followed by a T wave which is the repolarization wave of the heart as it resets itself for the next beat. 02:07 And the U wave sometimes occurs very often in patients with low blood potassium. 02:13 Here is a normal sinus rhythm. Notice, we've talked about this in earlier slides and in earlier lectures. 02:21 The P wave comes just before the QRS and it is less than five little boxes from the beginning of the P wave to the beginning of the QRS. 02:31 And these are normal ECG complexes, nice narrow QRS. 02:35 And you've seen this normal ECG before. 02:40 This is somebody with nice, normal progression of the R waves across the precordium from almost a tiny R wave in lead V1 to a dominant R wave in V4, 5 and 6 as it goes over the left ventricle. 02:55 And also, the axis is normal with the maximum R wave in lead II. 03:00 And the T waves are all up right, it's a nice, normal ECG.
About the Lecture
The lecture Review of Normal ECG by Joseph Alpert, MD is from the course Electrocardiogram (ECG) Interpretation.
Included Quiz Questions
An acute myocardial infarction causes changes in which ECG segments? Select all that apply.
- T wave
- U wave
- QRS complex
- ST segment
- Q wave
Which of the following indicates the proper order of the waves in an electrocardiogram?
- P wave → PR segment → QRS complex → ST segment → T wave
- QRS complex → P wave → PR segment → ST segment → T wave
- T wave → TR segment → QRS complex → SP segment → U wave
- P wave → PR segment → QRS complex → U wave → T wave
- P wave → PR segment → T wave → U wave → QRS segment
Author of lecture Review of Normal ECG

Joseph Alpert, MD
Customer reviews
5,0 of 5 stars
| 5 Stars |
|
1 |
| 4 Stars |
|
0 |
| 3 Stars |
|
0 |
| 2 Stars |
|
0 |
| 1 Star |
|
0 |
1 customer review without text
1 user review without text
