Playlist
Show Playlist
Hide Playlist
Reading ECGs and Identifying Arrhythmias – Cardiac Dysrhythmia

-
13 Lecturio Cardiac dysrhythmias.pdf
-
Reference List Cardiology.pdf
-
Download Lecture Overview
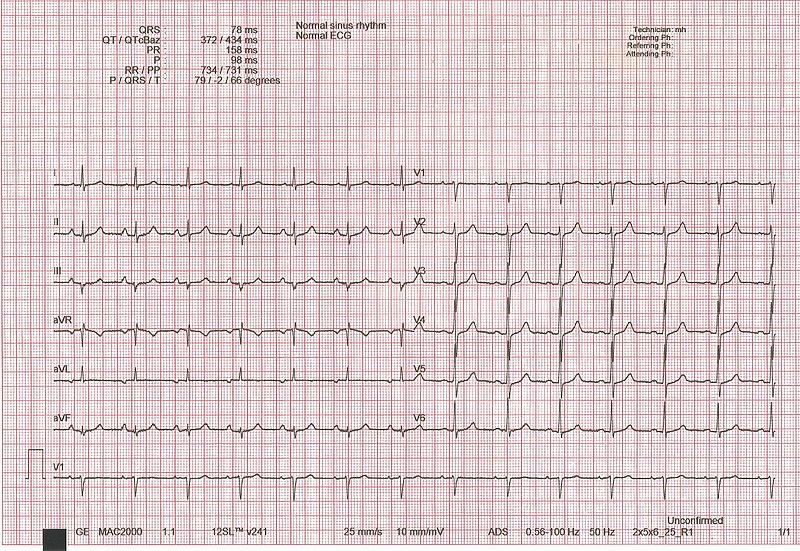
00:08 Welcome back to section 13 of "Introduction to Cardiology". In this section, we're going to be talking about electrical abnormalities in the heart that is cardiac arrhythmias also known as cardiac dysrhythmias. Now, this slide, of course, has nothing to do with arrhythmias, it has to do with the way we read an electrocardiogram. Everybody recognizes this, this is Van Gogh’s Starry Night. If I put this up on the other side of the room and people walked into the room, they would immediately say, “Oh, there's Van Gogh’s Starry Night.” How is it you recognize that? You recognized it because the human brain is wonderful at pattern recognition. This is something that probably developed long ago in our evolutionary history when having excellent pattern recognition could mean the difference between life and death in a very dangerous environment many many hundreds of thousands or even millions of years ago. Pattern recognition is a great property of the human brain and we use it to read electrocardiograms. So, let’s have a little quiz. Of course, you recognize this immediately, it’s Leonardo da Vinci’s Mona Lisa. You see it all the time in a whole variety of ways. If we put it up a far distance away across the room you, would walk in and say immediately, “Oh, there’s the Mona Lisa.” So, again, the human brain is wonderful at pattern recognition and we use this skill when we read electrocardiograms, not in the beginning. In the beginning, it’s like the first time you see the Mona Lisa or the first time you see Van Gogh’s Starry Night; you have to learn to recognize that pattern, but every time after that, “Oh, I know what that is, I recognize that pattern.” So, reading an electrocardiogram consists of couple of phases. The first phase is the overall Gestalt that is I recognize the pattern. 02:04 The second phase is where you do very meticulous measurements and analyze each component of the electrocardiogram which has 12 different components that we're going to talk about in a moment. In fact, these days, most electrocardiograms are read by computer. So, you say to me, “Well, why should I even bother to learn to read a cardiogram? The computers going to do the job.” Unfortunately, the computer is not as good at pattern recognition as you are and the computer makes a mistake about 20% of the time and many of those errors are in recognizing arrhythmias. Consequently, an experienced person, usually a cardiologist or even an electrophysiologist, a cardiac electrophysiologist read the cardiogram again and checks to see whether the computer is right. 80% of the time, the computer gets a check. 20% of the time we say, “Bad computer, you blew this one, we have to change the reading.” And that’s because the human brain is still better than the computer for recognizing the patterns. Well, here you see again, we start off in reading the electrocardiogram by recognizing the rhythm. Is this patient in a regular rhythm? Is this sinus rhythm? I’m going to show you a number of examples of that, then how fast is the patient’s heart going, is it a slow rate, is it a normal rate, is it a fast rate and then we have to look at the various intervals within the electrocardiogram. 03:36 Is the conduction normal through the atrium? Is the conduction normal through the AV node - the atrioventricular node? Is the conduction normal through the ventricle? Are there extra beats? We do each of these detailed things after we see the original Gestalt of the EKG. 03:54 I’m going to show a number of diagrams of the electrocardiogram and take you through
About the Lecture
The lecture Reading ECGs and Identifying Arrhythmias – Cardiac Dysrhythmia by Joseph Alpert, MD is from the course Cardiac Diseases.
Included Quiz Questions
Which of the following is an important initial step in the general interpretation of an electrocardiogram?
- Rhythm
- QRS amplitude
- QT interval
- ST segment elevation
- U wave
What percentage of times does the computer interpret an electrocardiogram correctly?
- Approximately 80%
- Approximately 20%
- Approximately 40%
- Approximately 60%
- Approximately 95%
Author of lecture Reading ECGs and Identifying Arrhythmias – Cardiac Dysrhythmia

Joseph Alpert, MD
Customer reviews
5,0 of 5 stars
| 5 Stars |
|
5 |
| 4 Stars |
|
0 |
| 3 Stars |
|
0 |
| 2 Stars |
|
0 |
| 1 Star |
|
0 |
