Playlist
Show Playlist
Hide Playlist
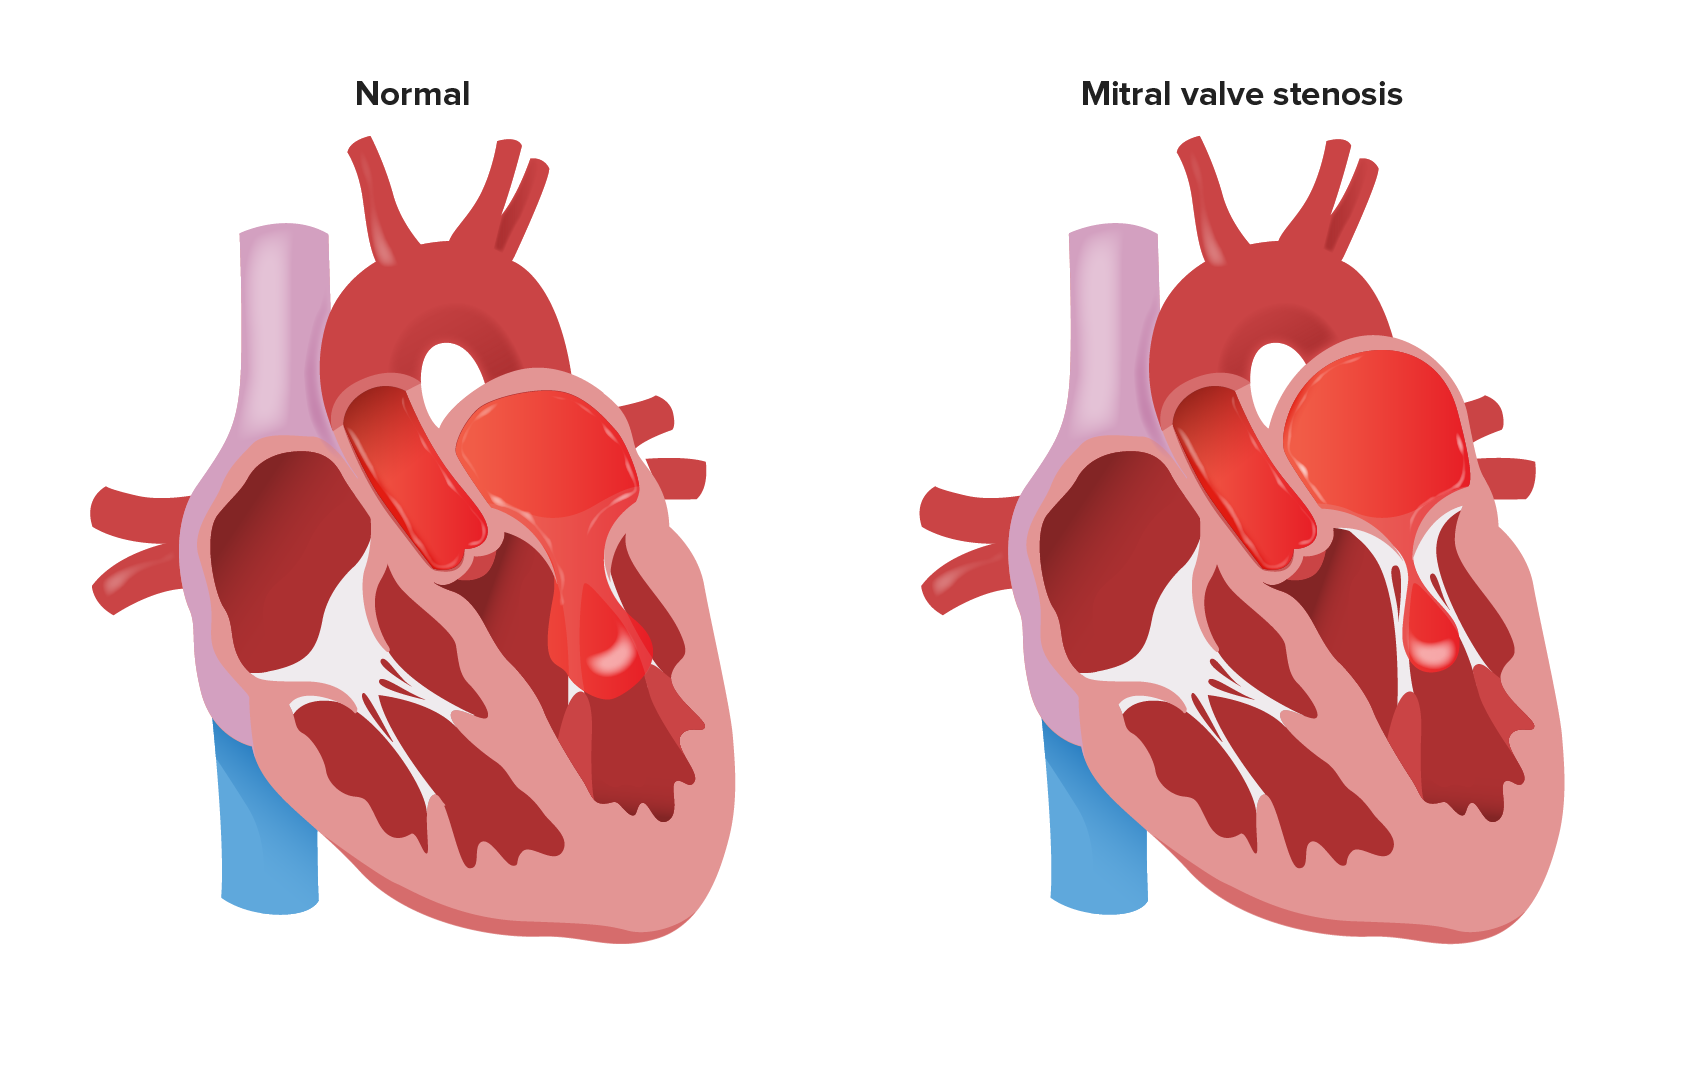
Mitral Stenosis: Visualization

-
Slides ValvularHeart DiseaseMitralStenosis CardiovascularPathology.pdf
-
Download Lecture Overview
00:01 That is not a good thing. What does pulmonary edema mean to you? Shortness of breath, dyspnea because of improper respiratory functioning. Now as we have done with many of the other valvular heart diseases, we have brought in the pathophysiology. Let us do the same thing here as well, please. It is in your best interest once more to make sure that your physiology is absolutely emboldened so that you can understand the pathology here. Let us take a look at the two graphs, yet once again. Now I am going to make sure that you are able to identify exactly as to what each curve represents. For example, on the left that graph there represents the left ventricular pressure curve. Now, before the type of curves that you have seen has been the comparison of your left ventricular pressure curve to your aortic pressure, and so with that we had seen it with aortic stenosis, aortic regurg. Let it go. 00:53 You can do this. Let it go. It is okay. Don't be so attached to something especially when it is not relevant. The relevance here is the fact that I cannot properly open up my mitral valve. So why would you want to use the aortic pressure curve? Really why? So what might you want to use? The atrial tracing curve. The first time that really we are seeing this is to make sure that we dissect the normal and then see exactly as to what the pathology is. The pathology is the discrepancy. Do you see that orange grey shaded area? That shaded area underneath that curve, underneath the y-descent, the discrepancy between the atrial tracing curve and the left ventricular pressure curve represents mitral stenosis. Normally there should be no discrepancy, there should be no difference between those two curves. 01:42 There should be almost instinct curve, work with me here. But the fact that you find such a large seperation between those two curves. What two curves again? Left ventricular pressure curve and the atrial tracing curve, represents right off the bat, mitral stenosis. 01:57 No doubt. Now, before we get there though, there is an important point that we need to identify along the way. Just take a look at the atrial tracing curve, which is that red solid line. We have an a wave. Before we begin, you tell me really quick where am I in terms of your cardiac cycle? Diastole or systole? Diastole. We are part of diastole. 02:21 Early or late, is this important? Oh! yeah. This is late diastole. How can you confirm that? Ask me that. "Dr. Raj how can you confirm that?" The a wave represents what? It represents the SA node, it conducts an impulse. So an impulse has now originated where? In the right atrium. 02:42 Are you with me? The SA node starts up an impulse. Now that impulse travels through first, which are represented on an EKG as what wave? Work with me, all about integration. 02:52 You cannot compartmentalize this information any longer. Welcome to medicine. Welcome to pathology. Welcome to our course. So our SA node on your EKG represents the P wave. This is the a wave. One has nothing to do with the other. Well, it does, but let us talk about how. The electrical activity is the P wave. It will run through the heart first, followed by mechanical activity always in that order. So that a wave represents mechanical activity of what chamber? The atria. Which atria? Obviously referring to mitral stenosis. 03:28 So, therefore, it is the left atria. Right? So that a wave is going to kick in. It kicks the last bit of blood about 10 to 15 percent of the blood from the left atrium into left ventricle. It creates an a wave. Part of what? Late diastole. Right? Next, what are you going to do? Well next I am going to try to close my mitral valve, isn't that right? You see where there S1 is on the heart sound, on the top of the curve here. That S1 represents closure of what? The mitral valve. Any problems with closing? No. This is not regurgitation. These are problems with opening, mitral stenosis. So you are not going to have a problem there. Do not choose that as being an answer choice. That makes no sense. So you will close your valve as you should. Now you have a c wave? What does that mean? Fifty percent of your patients won't even show you a C wave. Now technically, what does that actually mean? Well here is my left ventricle. It is about to do what? Isovolumetric contraction, increase in the pressure in the left ventricle so that it can guarantee blood moving from left ventricle into the aorta. Are you with me? Are you feeling me? I hope so. That left ventricle is shooting the blood into the aorta. So that build enough pressure to open up that aortic valve. The aortic pressure curve is not represented here. 04:45 No need. Why put unnecessary information when it's not even relevant? But you are building up that pressure. When you build up that pressure is it possible, it is just possible that the mitral valve might then bulge its cusps into the atria? Of course. Welcome to c wave. Bulging of the cusps. So now what happens? Blood is being ejected from the ventricle into the aorta. Close your eyes. In the meantime, what about that atria? That atria was empty but you got to fill it up. So how do you fill it up? You fill it up with pulmonary veins. 05:17 So the pulmonary veins are filling up the left atrium. Are you with me? All of this is occuring as one unit, as one organised syncytium, absolute miraculous. 05:29 Unbelievable. So now you create the v wave. What does that v wave represent? It is the fullest that the atria is going to get and in this case, it would be the left atrium. 05:39 Filled by whom? The pulmonary veins. Are we clear? Answer restoundingly yes. So now, left atrium is completely filled with blood. You created the v wave. I wanted you to take a look at S2. What does S2 mean to you? Why isn't S2 corresponding to the V wave? Because S2 is closure of whom? Of the aortic valve, isn't it? So what does the v wave represent? Opening of the mitral valve. That is her pathology. So the v wave is when the left atrium being the fullest and you are about to begin diastole. You are about to open up the mitral valve when the blood should be rushing into the left ventricle passively 85 to 90 percent of your filling takes place, then and there. But your mitral valve doesn't want to open. 06:34 So, therefore, what happens to my left atrial pressure? It increases. Where is this in correlation to my heart sounds? S2, aortic valve closes. No problem with aortic valve. Let it go. Opening snap, diastolic rumble. Welcome to mid diastolic rumble. Right before that it had an opening snap. Is that clear? So what is it that you have after the v wave? Normally you should have what? Tell me what you should have normally? A descent. What descent? The x or y-descent? The y-descent. But this is a pathology. You don't have the y-descent. How could you? What does the y-descent represent? It represents the passive filling of majority of your blood from left atrium into left ventricle. It ain’t happening. Is that clear? So when you have absence of your y-descent, you will have seperation of the curves, which to you should mean mitral stenosis. 07:27 Do you see the four picture? Do you really see it in your head? And that is why you won't misses a question? What I wish to point out to you, that you may or may not like, but you have to accept, is the fact that opening snap do not confuse with the mid-systolic click, alright? Because what kind of murmur is this? It is a diastolic murmur. So why in the world would you even call it a mid-systolic click. A mid-systolic click we will see with MVP, mitral valve prolapse, but not here. So an opening snap is part of your diastolic murmur, part of your mitral stenosis, but what does that mean to you clinically? What you must know is that opening snap, the closer that it gets, listen to what I am saying and forever etch it in your head. The closer that the opening snap gets to S2, the worse the valvular heart disease is. Clear? What does the opening snap mean to you? It means that the thicker that the mitral valve becomes, very thick. The opening snap occurs in diastole after the second heart sound. It relates to the opening of the mitral valve leaflets. The interval between the second heart sound and the opening snap represents the isovolumetric relaxation of the left ventricle. 08:41 When the mitral valve is severely stenosed, the left atrial pressure is very increased. 08:46 The closer the opening snap is heard to the second heart sound, the greater the left atrial pressure and the greater the severity of mitral valve stenosis. Remember as to how we did aortic regurgitation and Austin flint murmur, worst case scenario and I gave you what? The rule of 5, 3, 2. Same concept. 09:09 This is opening snap with mitral stenosis and that is a more complicated issue. Let us take a look at the one in which you can really sum things up. 09:14 So look at the pressure-volume loop on your right. Then we have the red loop, which is perfectly normal whereas the blue curve then represents mitral stenosis. Now the first thing that you want to do first and foremost, what does that loop represent? What chamber does that loop represent? It represents the left ventricle. That is it. So if that loop only represents the left ventricle and your mitral valve doesn't want to open, then what is the size of your left ventricle? It is tiny. It is small. Now, what graph or what component or what axis represents the volume on this graph? The X-axis. So, therefore, if there is less volume in your left ventricle, what would you expect this loop to do? It's shifted to the right. Would you please listen what I am saying? Why would it ever shift to the right? That would mean an increase in volume of your left ventricle. That is the opposite of what is happening here. See you would never choose the loop in red as being mitral stenosis. 10:15 When you have obviously a loop that shifted to the left, which represents what? A smaller left ventricle. Welcome to mitral stenosis. Now where is my problem? What if you see the circle around where the mtiral valve should open on your pressure-volume loop? That black circle. That black circle represents the actual pathology. The mitral valve doesn't want to open. You chose that as being your answer choice. And if they put A, B, C, D, E, F, I don't care how many are there, A to Z, if they are able to put around that loop, you choose the one. That represents, where the circle is representing the pathology. 10:52 The mitral valve doesn't want to open. You have understood that you are gold when it comes to mitral stenosis. How can you miss the question, seriously?
About the Lecture
The lecture Mitral Stenosis: Visualization by Carlo Raj, MD is from the course Valvular Heart Disease: Basic Principles with Carlo Raj.
Included Quiz Questions
Which of the following is the most common cause of mitral stenosis?
- Rheumatic heart disease
- Congenital mitral stenosis
- Bicuspid valve
- Low output-cardiac failure
- Pericarditis
Which part of the heart is often enlarged due to mitral stenosis?
- Left atrium
- Left ventricle
- Right atrium
- Aorta
- Right ventricle
Which of the following values would suggest left atrial enlargement secondary to mitral stenosis?
- PCWP of 21 mmHg
- Central venous pressure of 7 mmHg
- Left atrial pressure of 9 mmHg
- Left ventricular systolic pressure of 120 mmHg
- Right ventricular systolic pressure of 25 mmHg
Which stage of the ECG corresponds to the "a wave" in the left atrial tracing curve?
- P wave
- Q wave
- T wave
- QRS complex
- Delta wave
Which segment of the atrial tracing curve is not found in mitral stenosis?
- y-descent
- a-wave
- x-descent
- c wave
- v wave
What is the differentiating feature in the murmur between severe mitral stenosis and mild mitral stenosis?
- The opening snap is closer after S2 in severe mitral stenosis compared to mild mitral stenosis
- The opening snap occurs later in diastole in severe mitral stenosis.
- The murmur occurs through most of the diastole in severe mitral stenosis.
- A mid-systolic click occurs in severe mitral stenosis.
- The murmur is best heard around the apex in severe mitral stenosis and in the 2nd intercostal space in mild mitral stenosis.
Author of lecture Mitral Stenosis: Visualization

Carlo Raj, MD
Customer reviews
3,0 of 5 stars
| 5 Stars |
|
1 |
| 4 Stars |
|
1 |
| 3 Stars |
|
0 |
| 2 Stars |
|
1 |
| 1 Star |
|
1 |
Probably the best lecturer on lecturio. He engages directly and makes the learning easier. All of the lectures on the valvular heart diseases have been engaging and humorous, and cater to a real world like setting which is important.
Just wanted to say after reading frequent comments on here, try not to take Dr. Raj's commentary too personally. He's not talking about YOU specifically when he says "why would you do that?".. He's just pointing out common mistakes that people make. I personally like it because it helps me identify areas where I might have gotten mixed up later. It's just his style- I doubt his intention is to be demeaning. He's trying to really solidify the information from a variety of angles, that's all.
This doctor is always demeaning. He clearly demonstrates why instructors should learn to say phrases like "Some students" or "often times students will confuse..." It is significantly less demeaning than "You". Also, he ASSUMES we are thinking wrong "Why in the world would you?", "Don't do that!" , or "Let it go!" I never had it, so why would I let it go??? He needs to eliminate all these comments about how he thinks we are thinking and just communicate the information. It is hard to concentrate on the pathophysiology when he is constantly projecting negativity. Learning is supposed to be a positive experience, not a negative one.
explica demasiado rapido y no señala las graficas para poder entender de que habla.
