Playlist
Show Playlist
Hide Playlist
ECG Trace – Cardiac Dysrhythmia

-
13 Lecturio Cardiac dysrhythmias.pdf
-
Reference List Cardiology.pdf
-
Download Lecture Overview
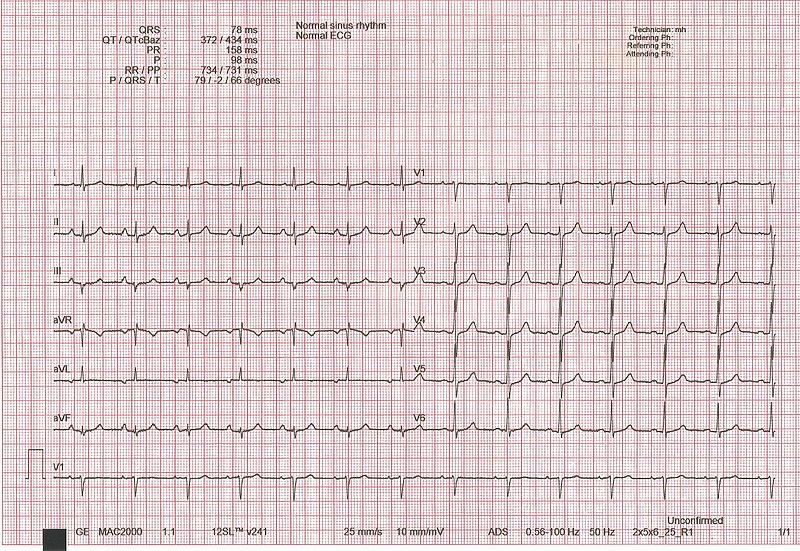
00:00 And then there is resetting of the ventricular muscle and that’s the T wave. And here we see an enlarged example of one heartbeat. You see the P wave, this starts with the sinus node beat, atrial depolarization is the P wave. 00:15 You'll see a little flat area that’s the delay in the AV node, then there's the QRS ventricular depolarization. There's a little pause then and the T wave is the ventricle resetting itself getting ready for the next beat for the next P wave. 00:35 So, one of the first things we do when we do an electrocardiogram is check the voltage calibration. The machine is set to have a certain calibration. If you set the calibration wrong, you’re going to make for either very large or very small complexes and you may misread the electrocardiogram. So, the first thing the technician does when they're doing a cardiogram is to check and make sure that the calibration is accurate. It’s like any test you do, you have to make sure that the equipment you're using to do the test is accurate before you start the test. What you see in this diagram is that there are 12 different positions where the leads look at the heart electrical activity. It’s as if you are looking at the heart from multiple points of reference. You look at it from one side, you look at it from the other side, you look at it from below, you look at it straight through and that’s what each of these little electrodes do, they record the electrical activity as seen at that particular point and when you put that all together, you actually could create a 3-dimensional electrical activity of the heart contraction. We have six so called limb leads that means there's leads on the... both arms and both legs and we have six precordial leads that is chest leads and you can see them in the fourth diagram from the left. 01:57 Each one of these goes around the left side of the chest and almost out into the armpit. 02:04 What is happening here is that we are looking, again, as I said, at the heart electrical activity from different angles. So, here you see six different leads, these are the leads that are obtained from the limb leads. And I always tell people it’s like this, one of the leads is out here, it’s looking at the heart coming in from the left arm. Another lead is looking at the heart activity, electrical activity coming from below. Another lead is looking at the heart activity coming from the right shoulder and we put all of these together. We know what a normal series of patterns would be for limb leads. If we then look at the precordial leads, you'll see that what you’re getting here are views as if we were putting needles through the heart as we go around the chest. So, we get not only a frontal view from the limb leads, but we also get a transverse view from the precordial leads. And you put all of those six different views together and there's a normal series of patterns for these 12 leads and there are abnormal and learning the abnormal and recognize them is the pattern recognition we talked about that has to be, of course, combined with more accurate and more careful analysis of the electrocardiogram. You've seen this cardiogram before in two previous lectures. I hope you recognize that this is a normal electrocardiogram. We’ll look at it, each component of this in a little more detail, but if you looked up close of this, you will discover there's a P wave in front of each QRS that is there's an atrial depolarization preceding each QRS depolarization and there's a T wave repolarization after each QRS. The axis, that is the direction of the electrical impulse in the heart is normal here. The PR intervals - the interval between the P wave and the QRS, is normal. The intervals following the T wave are normal. This is a completely normal heart rate and a normal electrocardiogram from a normal person.
About the Lecture
The lecture ECG Trace – Cardiac Dysrhythmia by Joseph Alpert, MD is from the course Cardiac Diseases.
Included Quiz Questions
There are 12 ECG leads to create a 3-dimensional electrical activity of the heart contractions. How many of these leads are limb leads, and how many are precordial leads?
- Six limb leads and six precordial leads
- Four limb leads and eight precordial leads
- Eight limb leads and four precordial leads
- Nine limb leads and three precordial leads
- Three limb leads and nine precordial leads
What does the QRS complex on the ECG indicate?
- Ventricular depolarization
- Atrial depolarization
- Ventricular repolarization
- Atrial repolarization
- A-V nodal delay
Author of lecture ECG Trace – Cardiac Dysrhythmia

Joseph Alpert, MD
Customer reviews
5,0 of 5 stars
| 5 Stars |
|
1 |
| 4 Stars |
|
0 |
| 3 Stars |
|
0 |
| 2 Stars |
|
0 |
| 1 Star |
|
0 |
he explained the topic (cardiac dsyrthmia) well and clearly. Thank you.
